stevenliuyi / covid19
- понедельник, 23 марта 2020 г. в 00:22:46
JavaScript
an interactive, animated COVID-19 coronavirus map to track the outbreak over time by country and by region for selected countries (including China, Italy, Korea, Japan, France, Germany, United States)
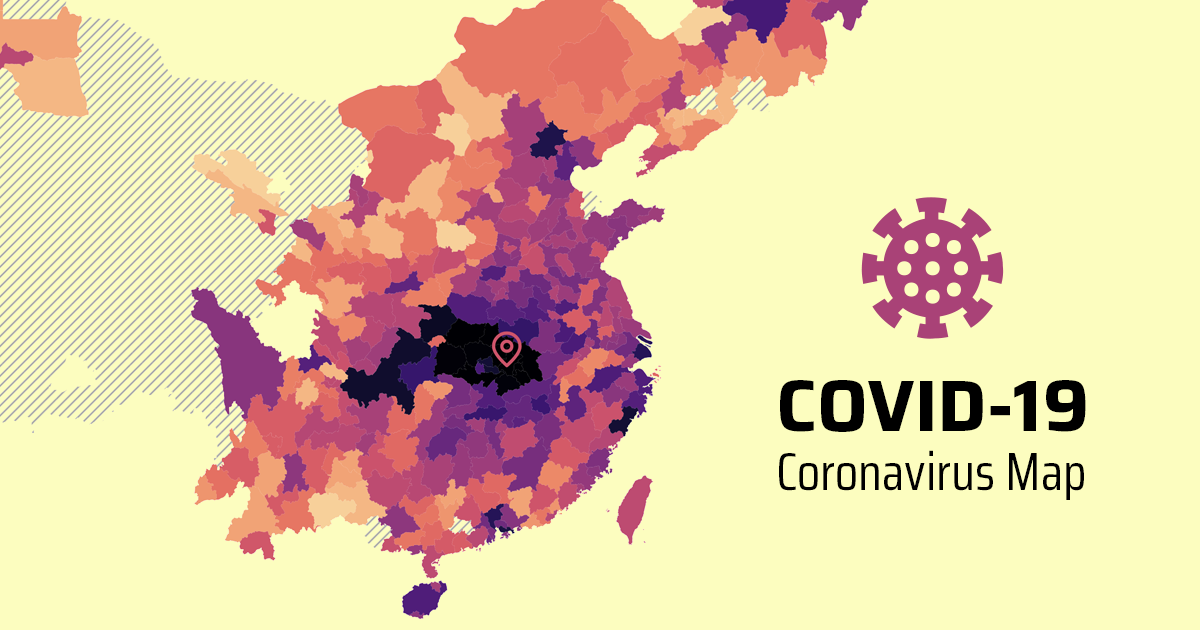
COVID-19 (2019-nCOV / SARS-CoV-2) Coronavirus Map (https://covid19.health) is an interactive, animated map for the COVID-19 coronavirus outbreak.
The map is based on multiple sources (see below for details). If you are interested, the integrated dataset can be found here. Note that numbers in different data sources may not match with each other exactly.
Pull requests are welcome. If you'd like to support the work and buy me a ☕, I greatly appreciate it!
Original map shapefiles are from GADM, which are converted to TopoJSON files using mapshaper.
