marcotcr / lime
- вторник, 5 апреля 2016 г. в 03:12:31
JavaScript
Lime: Explaining the predictions of any machine learning classifier
This project is about explaining what machine learning classifiers (or models) are doing. At the moment, we support explaining individual predictions for text classifiers, with a package caled lime (short for local interpretable model-agnostic explanations). Lime is based on the work presented in this paper. Our plan is to add more packages that help users understand and interact meaningfully with machine learning.
Lime is able to explain any black box text classifier, with two or more classes. All we require is that the classifier implements a function that takes in raw text and outputs a probability for each class. Support for scikit-learn classifiers is built-in.
The lime package is on pypy. Simply run:
pip install lime
Or clone the repository and run:
python setup.py install
For example usage, take a look at the following two tutorials (generated from ipython notebooks):
The api reference is available here.
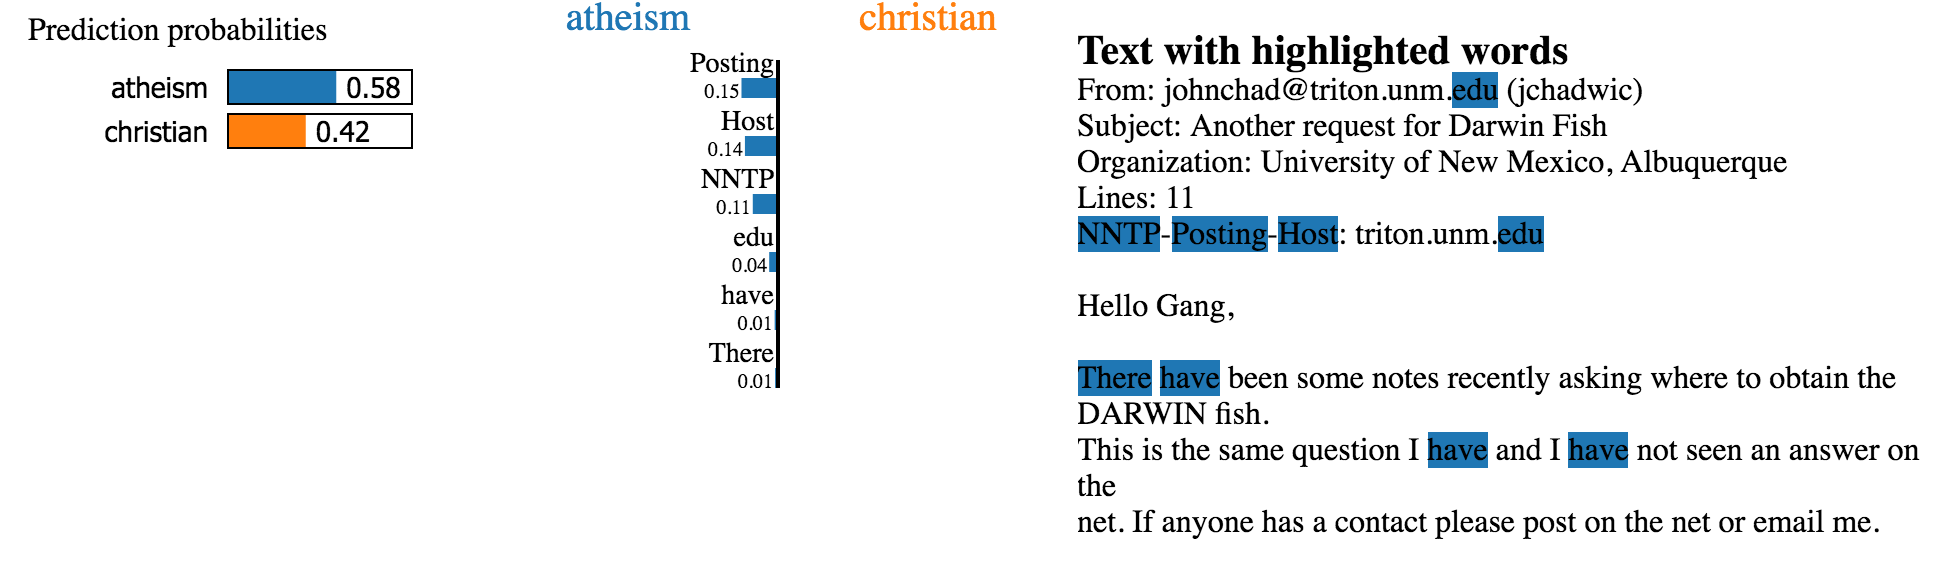
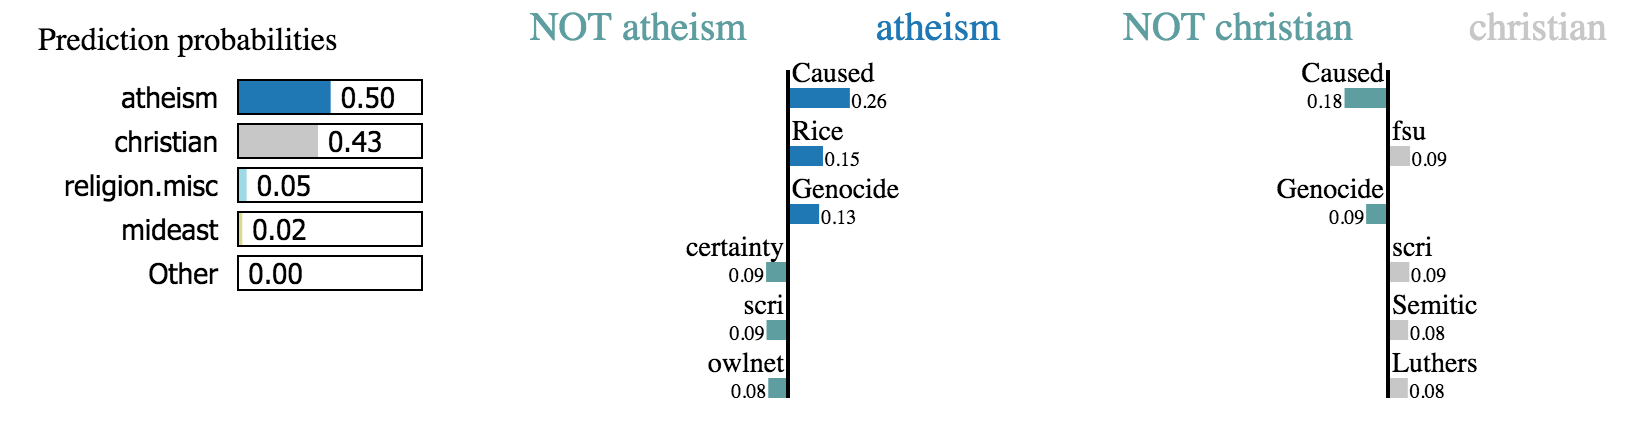
Below are some screenshots of lime explanations. These are generated in html, and can be easily produced and embedded in ipython notebooks. We also support visualizations using matplotlib, although they don't look as nice as these ones.
Negative (blue) words indicate atheism, while positive (orange) words indicate christian. The way to interpret the weights by applying them to the prediction probabilities. For example, if we remove the words Host and NNTP from the document, we expect the classifier to predict atheism with probability 0.57 - 0.14 - 0.12 = 0.31.
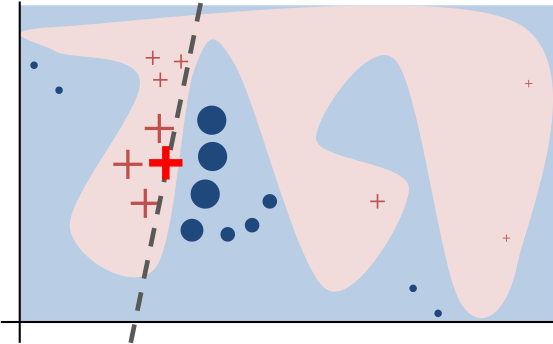
Intuitively, an explanation is a local linear approximation of the model's behaviour. While the model may be very complex globally, it is easier to approximate it around the vicinity of a particular instance. While treating the model as a black box, we perturb the instance we want to explain and learn a sparse linear model around it, as an explanation. The figure below illustrates the intuition for this procedure. The model's decision function is represented by the blue/pink background, and is clearly nonlinear. The bright red cross is the instance being explained (let's call it X). We sample instances around X, and weight them according to their proximity to X (weight here is indicated by size). We then learn a linear model (dashed line) that approximates the model well in the vicinity of X, but not necessarily globaly. For more information, read our paper.