man-group / dtale
- воскресенье, 23 февраля 2020 г. в 00:20:13
JavaScript
Flask/React client for visualizing pandas data structures


D-Tale is the combination of a Flask back-end and a React front-end to bring you an easy way to view & analyze Pandas data structures. It integrates seamlessly with ipython notebooks & python/ipython terminals. Currently this tool supports such Pandas objects as DataFrame, Series, MultiIndex, DatetimeIndex & RangeIndex.
D-Tale was the product of a SAS to Python conversion. What was originally a perl script wrapper on top of SAS's insight function is now a lightweight web client on top of Pandas data structures.
| PyCharm | jupyter |
|---|---|
 |
 |
Installing the egg
# install dtale egg (important to use the "--upgrade" every time you install so it will grab the latest version)
$ pip install --upgrade dtale
Now you will have the ability to use D-Tale from the command-line or within a python-enabled terminal
This comes courtesy of PyCharm
 Feel free to invoke
 python or ipython directly and use the commands in the screenshot above and it should work
If you run into issues with viewing D-Tale in your browser on Windows please try making Python public under "Allowed Apps" in your Firewall configuration. Here is a nice article: How to Allow Apps to Communicate Through the Windows Firewall
import dtale
import pandas as pd

df = pd.DataFrame([dict(a=1,b=2,c=3)])

# Assigning a reference to a running D-Tale process
d = dtale.show(df)

# Accessing data associated with D-Tale process
tmp = d.data.copy()
tmp['d'] = 4

# Altering data associated with D-Tale process
# FYI: this will clear any front-end settings you have at the time for this process (filter, sorts, formatting)
d.data = tmp

# Shutting down D-Tale process
d.kill()

# using Python's `webbrowser` package it will try and open your server's default browser to this process
d.open_browser()

# There is also some helpful metadata about the process
d._data_id  # the process's data identifier
d._url  # the url to access the process

d2 = dtale.get_instance(d._data_id)  # returns a new reference to the instance running at that data_id

dtale.instances()  # returns a dictionary of all instances available, this would be { 1: ... }
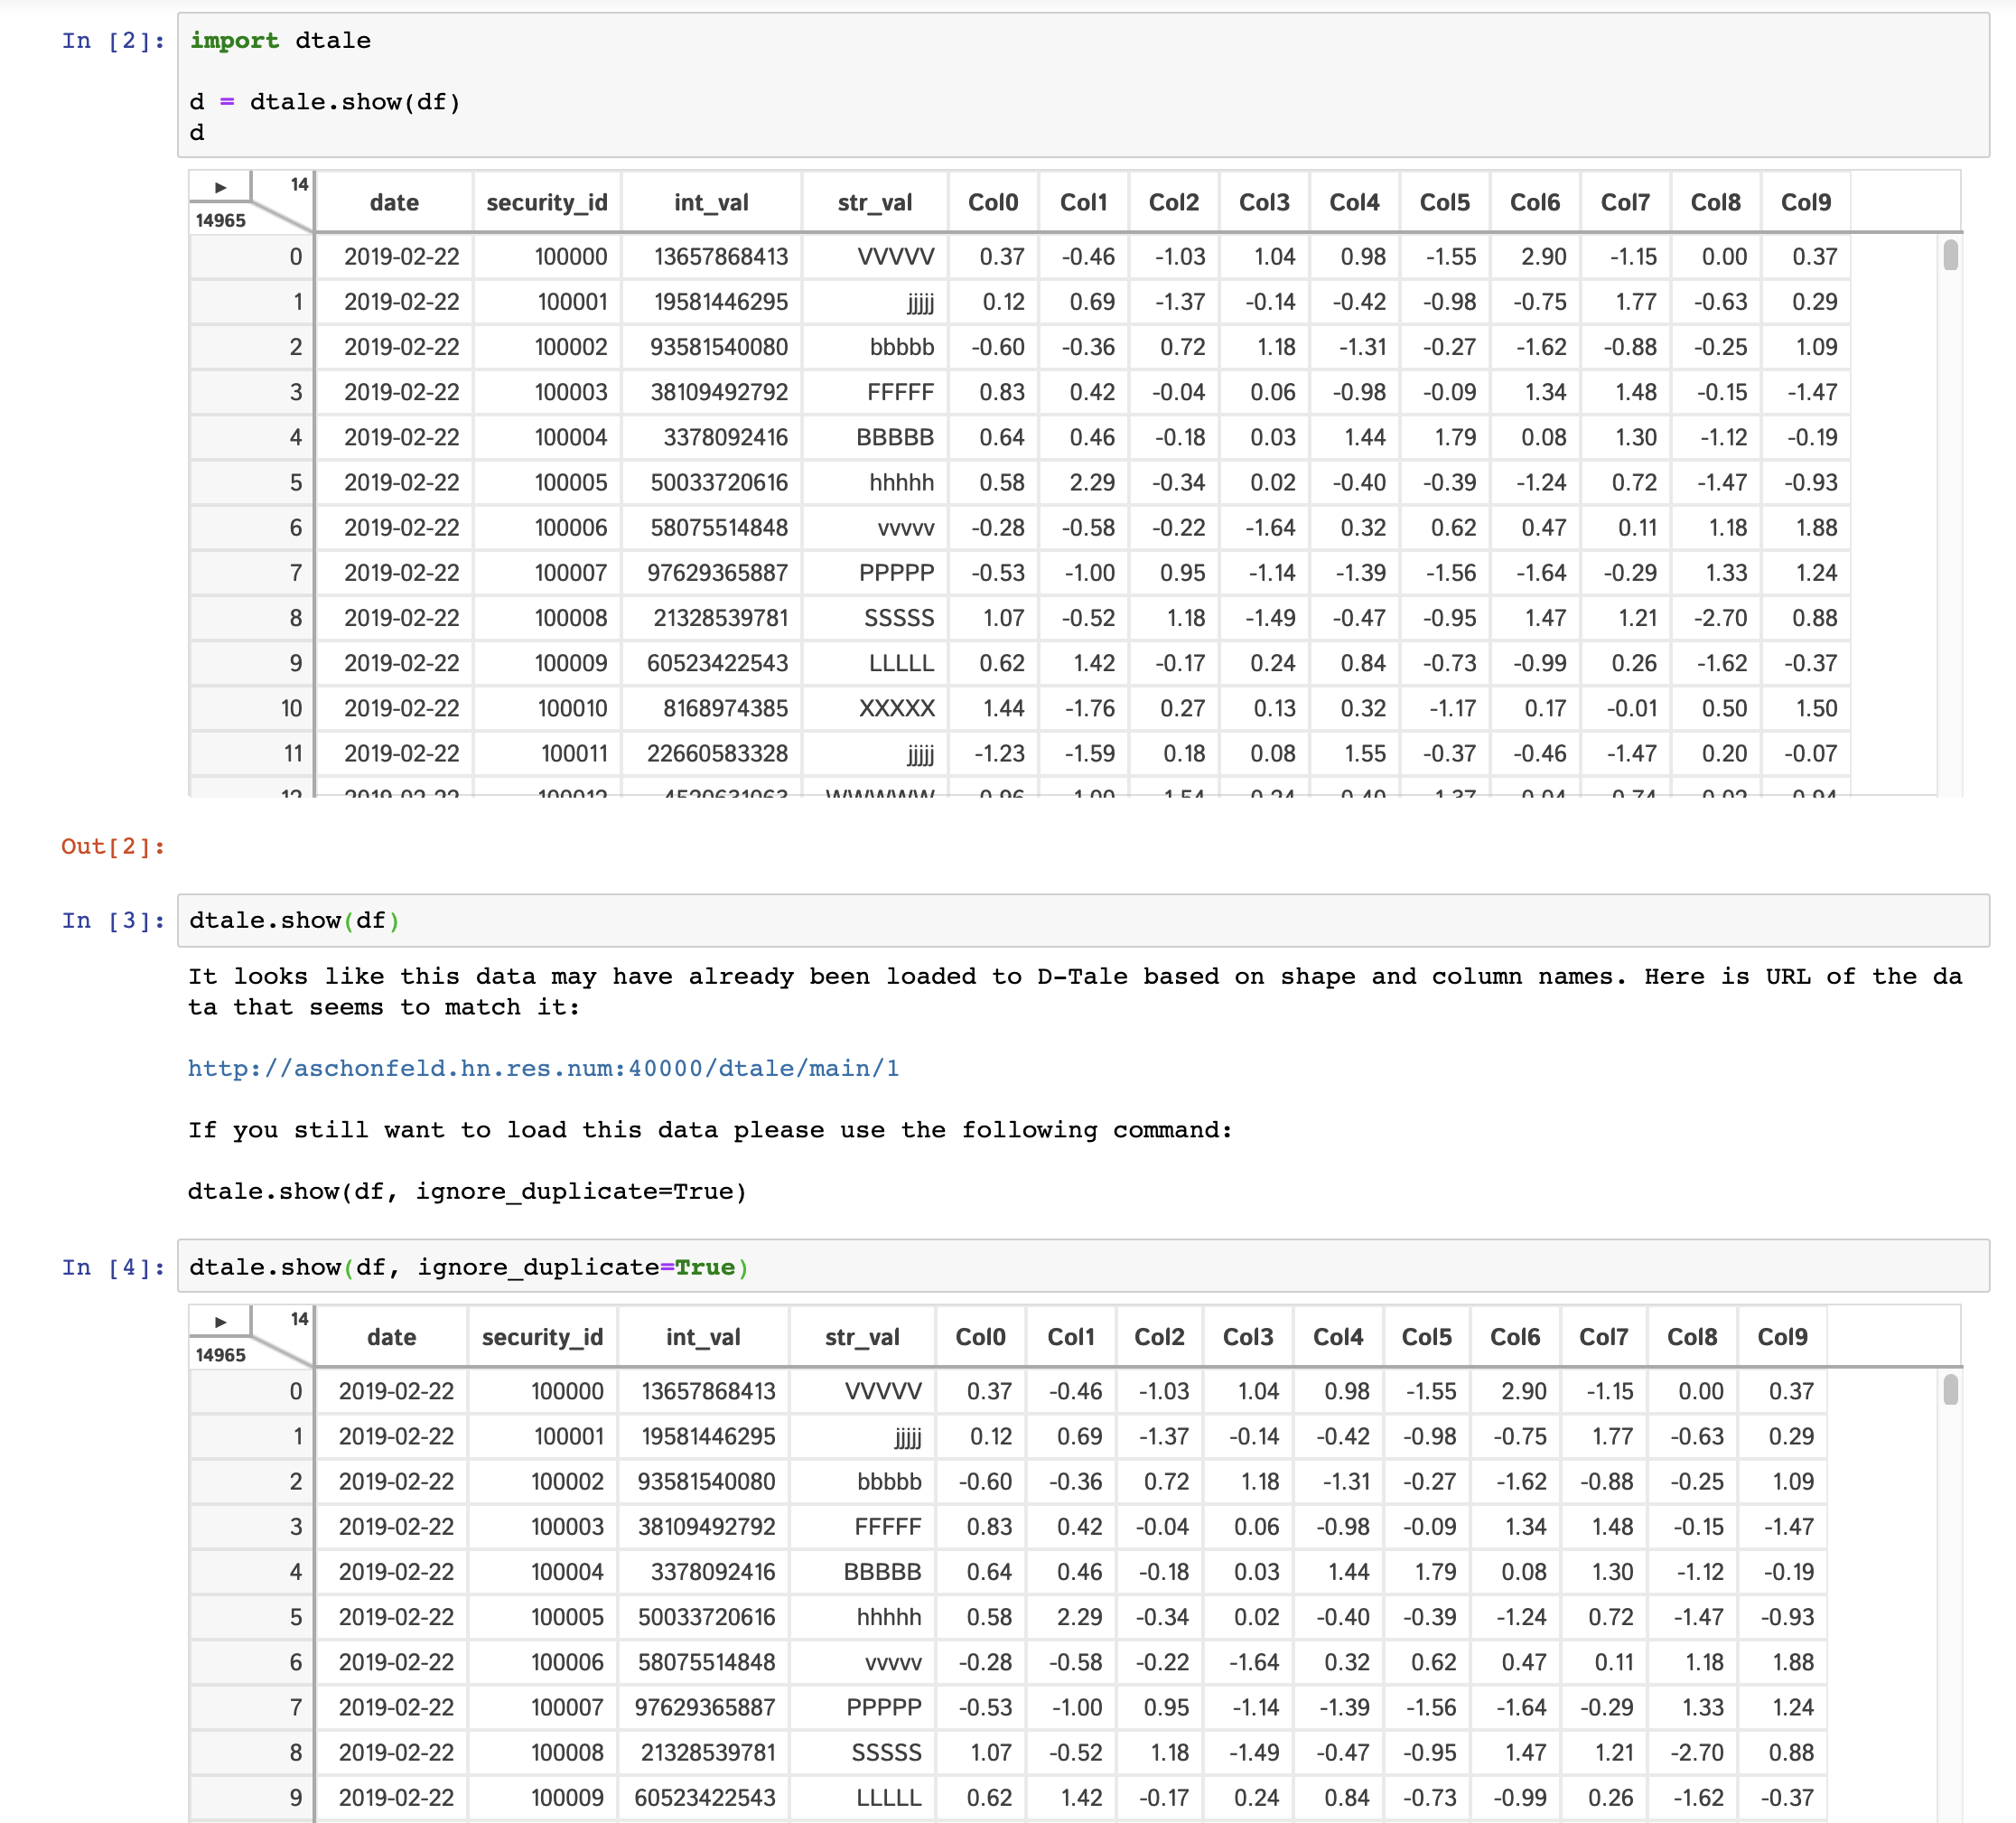
To help guard against users loading the same data to D-Tale multiple times and thus eating up precious memory, we have a loose check for duplicate input data. The check runs the following:
If both these conditions are true then you will be presented with an error and a link to the previously loaded data. Here is an example of how the interaction looks:
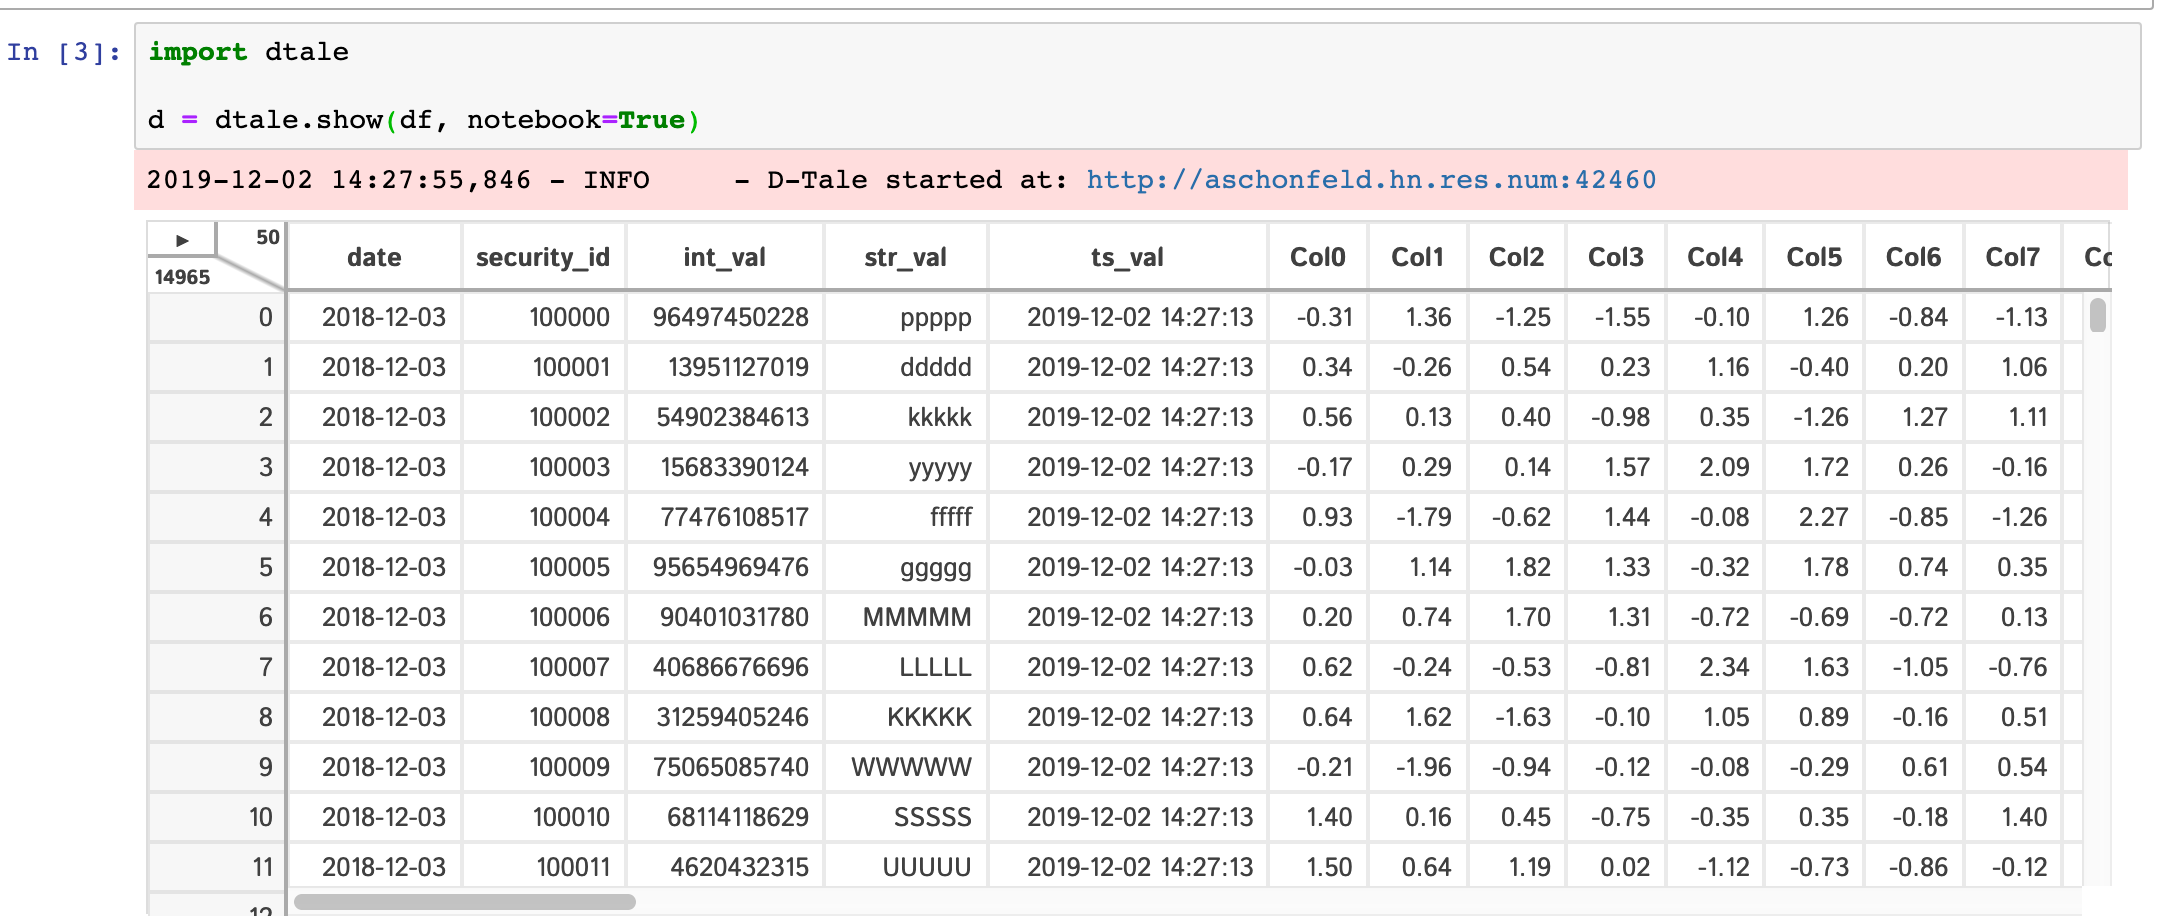
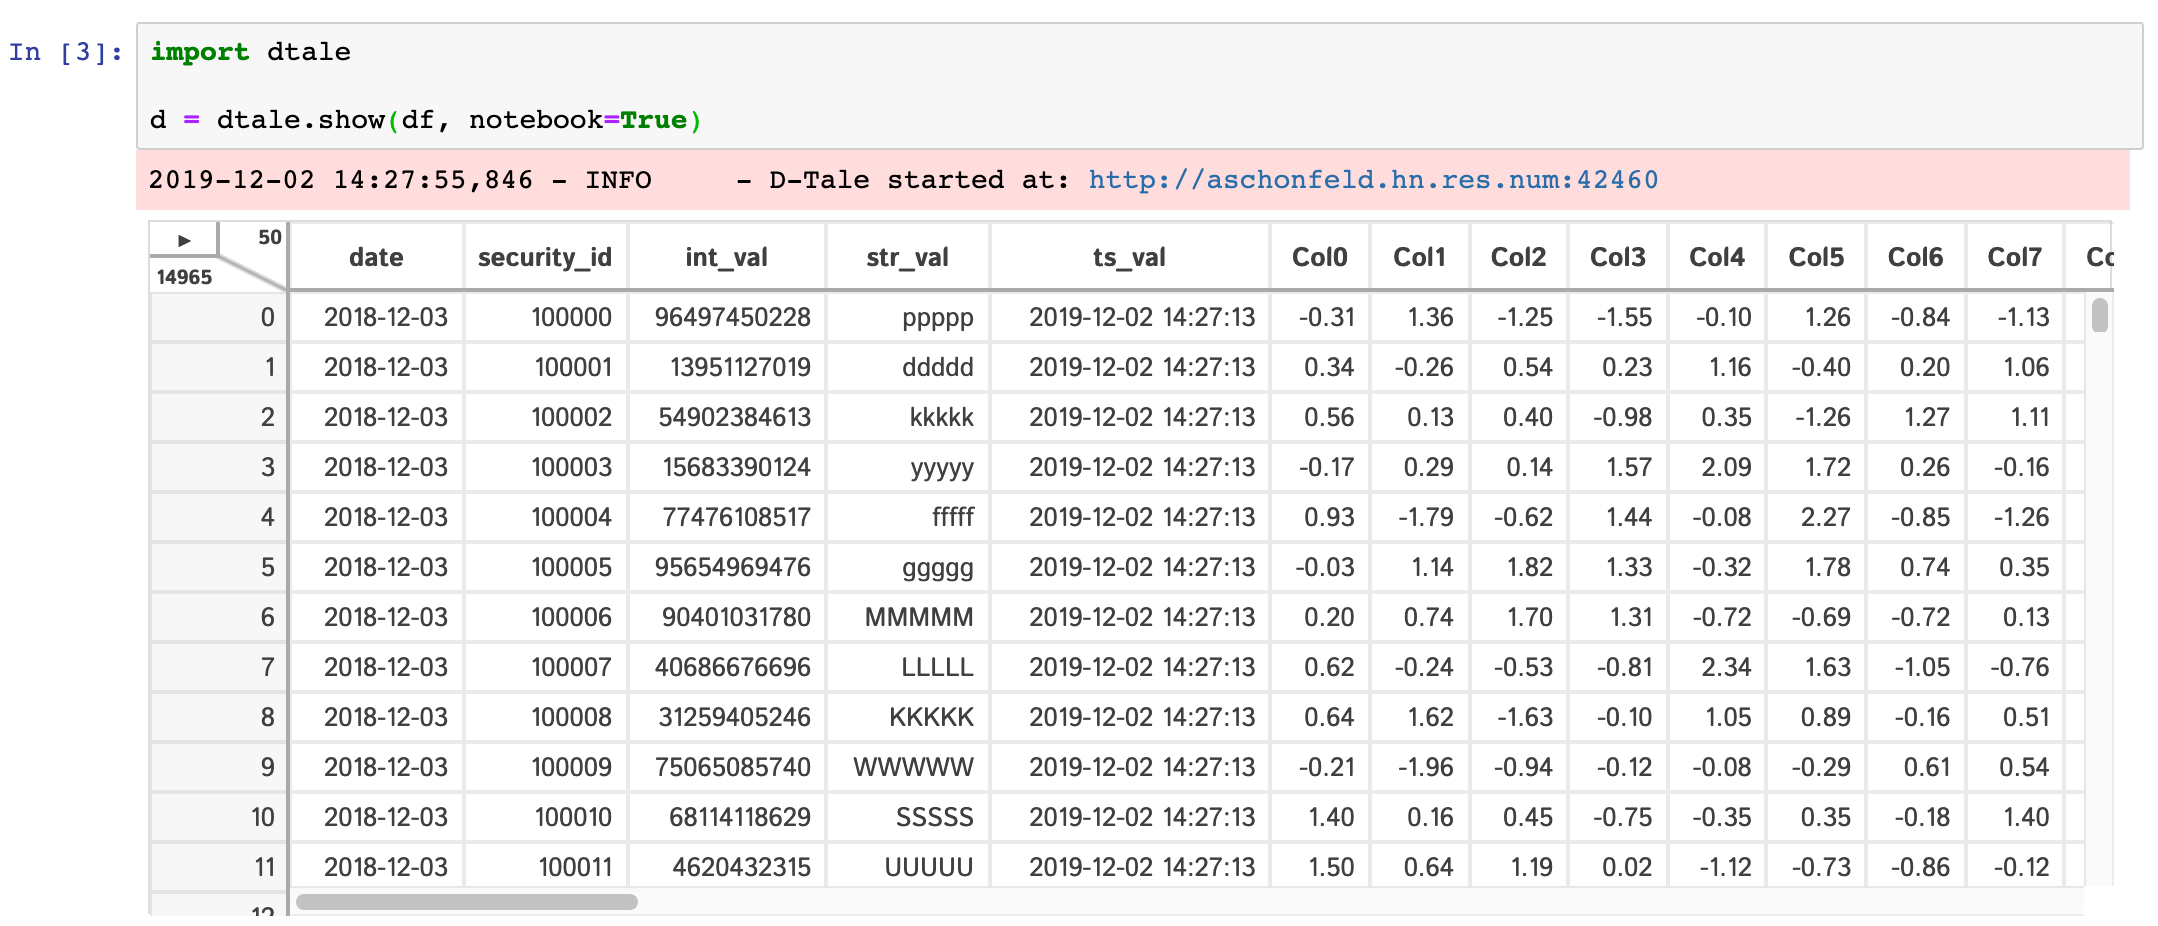
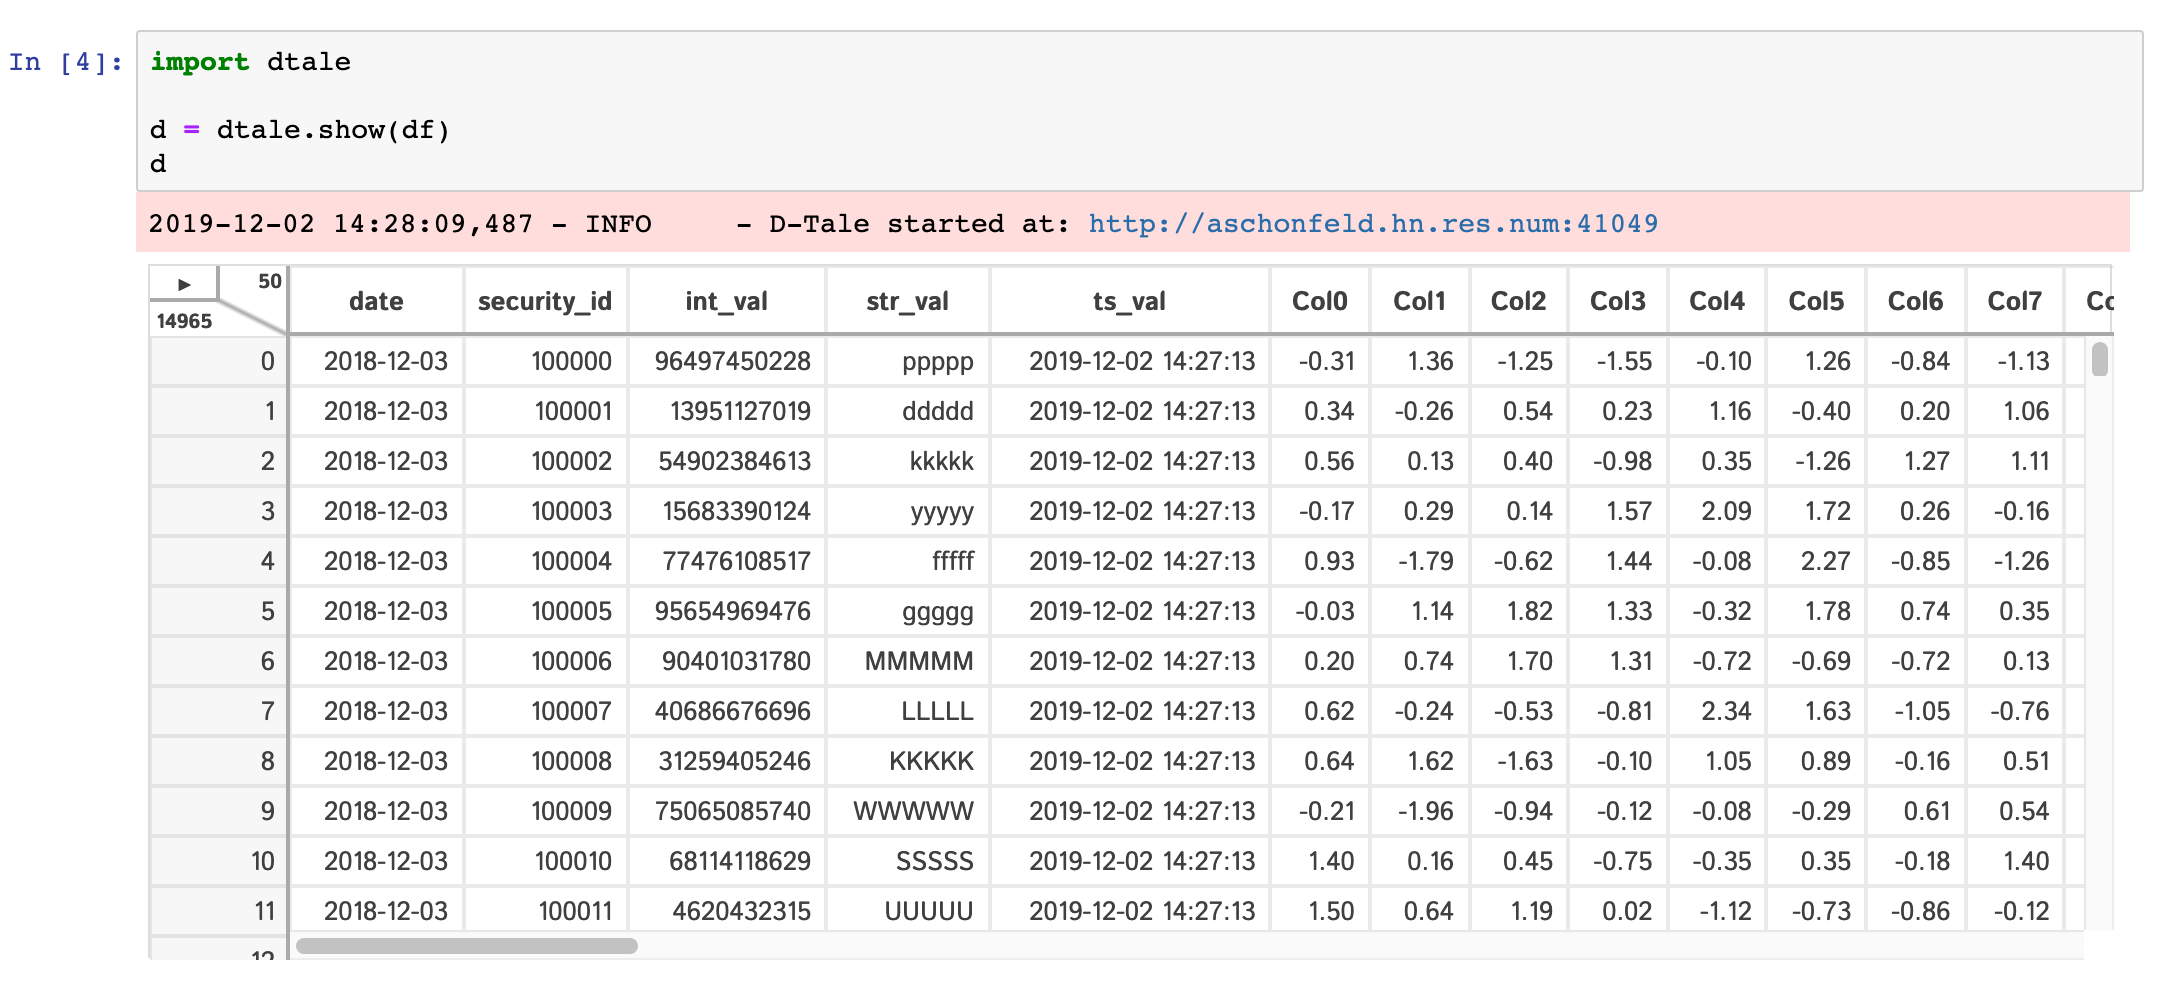
Within any jupyter (ipython) notebook executing a cell like this will display a small instance of D-Tale in the output cell. Here are some examples:
dtale.show |
assignment | instance |
|---|---|---|
 |
 |
 |
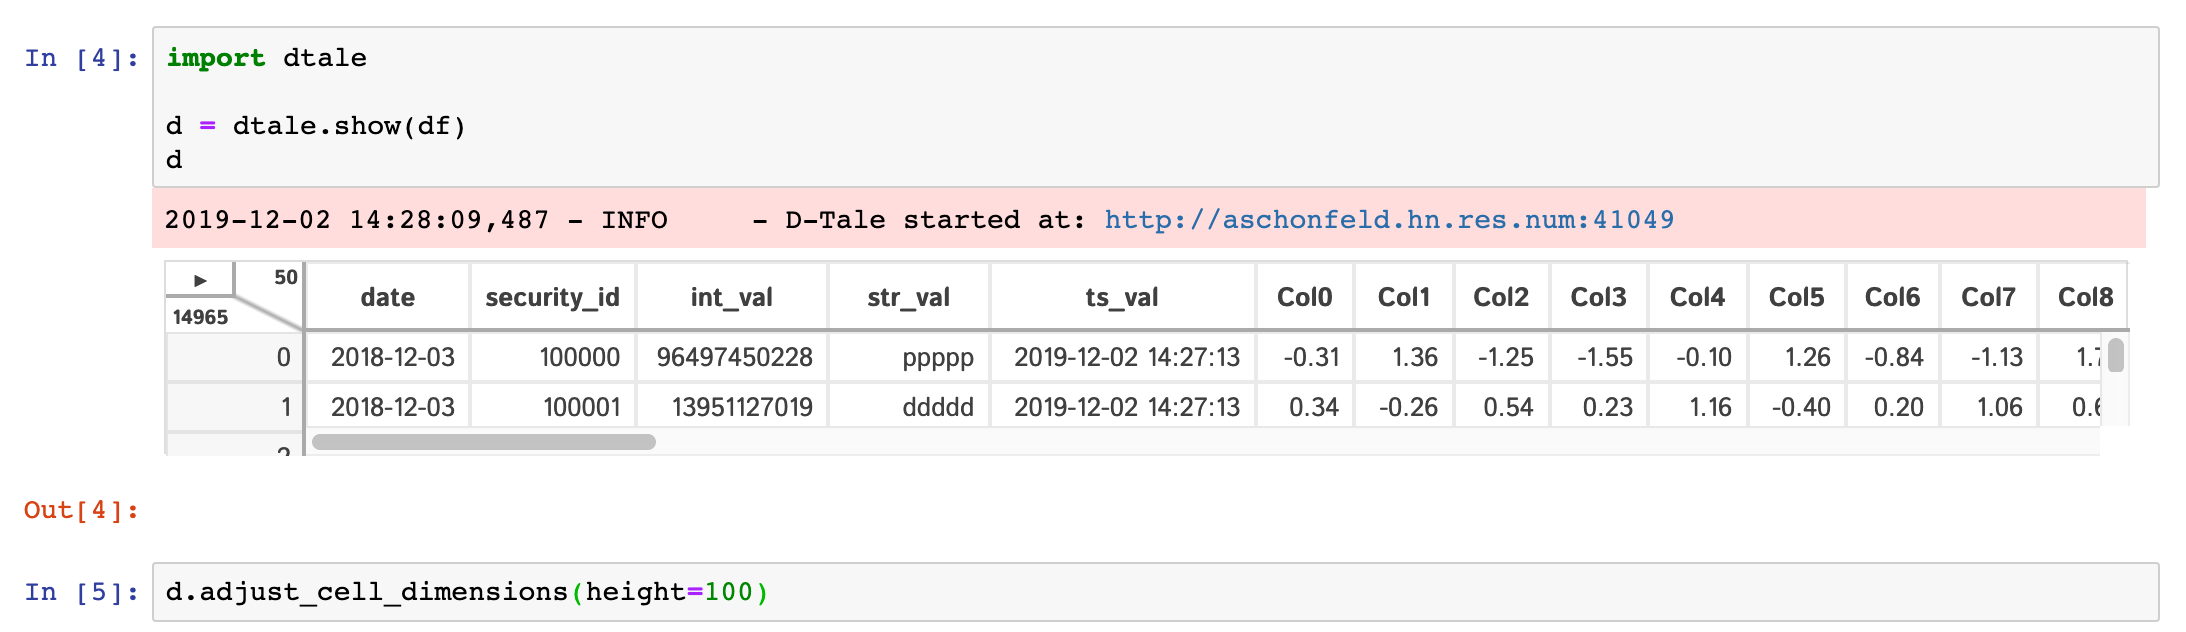
If you are running ipython<=5.0 then you also have the ability to adjust the size of your output cell for the most recent instance displayed:
One thing of note is that a lot of the modal popups you see in the standard browser version will now open separate browser windows for spacial convienence:
| Column Menus | Correlations | Describe | Histogram | Instances |
|---|---|---|---|---|
 |
 |
 |
 |
 |
Base CLI options (run dtale --help to see all options available)
| Prop | Description |
|---|---|
--host |
the name of the host you would like to use (most likely not needed since socket.gethostname() should figure this out) |
--port |
the port you would like to assign to your D-Tale instance |
--name |
an optional name you can assign to your D-Tale instance (this will be displayed in the <title> & Instances popup) |
--debug |
turn on Flask's "debug" mode for your D-Tale instance |
--no-reaper |
flag to turn off auto-reaping subprocess (kill D-Tale instances after an hour of inactivity), good for long-running displays |
--open-browser |
flag to automatically open up your server's default browser to your D-Tale instance |
--force |
flag to force D-Tale to try an kill any pre-existing process at the port you've specified so it can use it |
Loading data from arctic(high performance datastore for pandas dataframes)
dtale --arctic-host mongodb://localhost:27027 --arctic-library jdoe.my_lib --arctic-node my_node --arctic-start 20130101 --arctic-end 20161231Loading data from CSV
dtale --csv-path /home/jdoe/my_csv.csv --csv-parse_dates dateLoading data from JSON
dtale --json-path /home/jdoe/my_json.json --json-parse_dates dateor
dtale --json-path http://json-endpoint --json-parse_dates dateLoading data from a Custom loader
--arctic (this wouldn't work well in arctic's case since it depends on all those properties)def find_loader(kwargs) which returns a function that returns a dataframe or Nonefrom dtale.cli.clickutils import get_loader_options
'''
IMPORTANT!!! This global variable is required for building any customized CLI loader.
When find loaders on startup it will search for any modules containing the global variable LOADER_KEY.
'''
LOADER_KEY = 'testdata'
LOADER_PROPS = ['rows', 'columns']
def test_data(rows, columns):
import pandas as pd
import numpy as np
import random
from past.utils import old_div
from pandas.tseries.offsets import Day
from dtale.utils import dict_merge
import string
now = pd.Timestamp(pd.Timestamp('now').date())
dates = pd.date_range(now - Day(364), now)
num_of_securities = max(old_div(rows, len(dates)), 1) # always have at least one security
securities = [
dict(security_id=100000 + sec_id, int_val=random.randint(1, 100000000000),
str_val=random.choice(string.ascii_letters) * 5)
for sec_id in range(num_of_securities)
]
data = pd.concat([
pd.DataFrame([dict_merge(dict(date=date), sd) for sd in securities])
for date in dates
], ignore_index=True)[['date', 'security_id', 'int_val', 'str_val']]
col_names = ['Col{}'.format(c) for c in range(columns)]
return pd.concat([data, pd.DataFrame(np.random.randn(len(data), columns), columns=col_names)], axis=1)
# IMPORTANT!!! This function is required for building any customized CLI loader.
def find_loader(kwargs):
test_data_opts = get_loader_options(LOADER_KEY, kwargs)
if len([f for f in test_data_opts.values() if f]):
def _testdata_loader():
return test_data(int(test_data_opts.get('rows', 1000500)), int(test_data_opts.get('columns', 96)))
return _testdata_loader
return NoneIn this example we simplying building a dataframe with some dummy data based on dimensions specified on the command-line:
--testdata-rows--testdata-columnsHere's how you would use this loader:
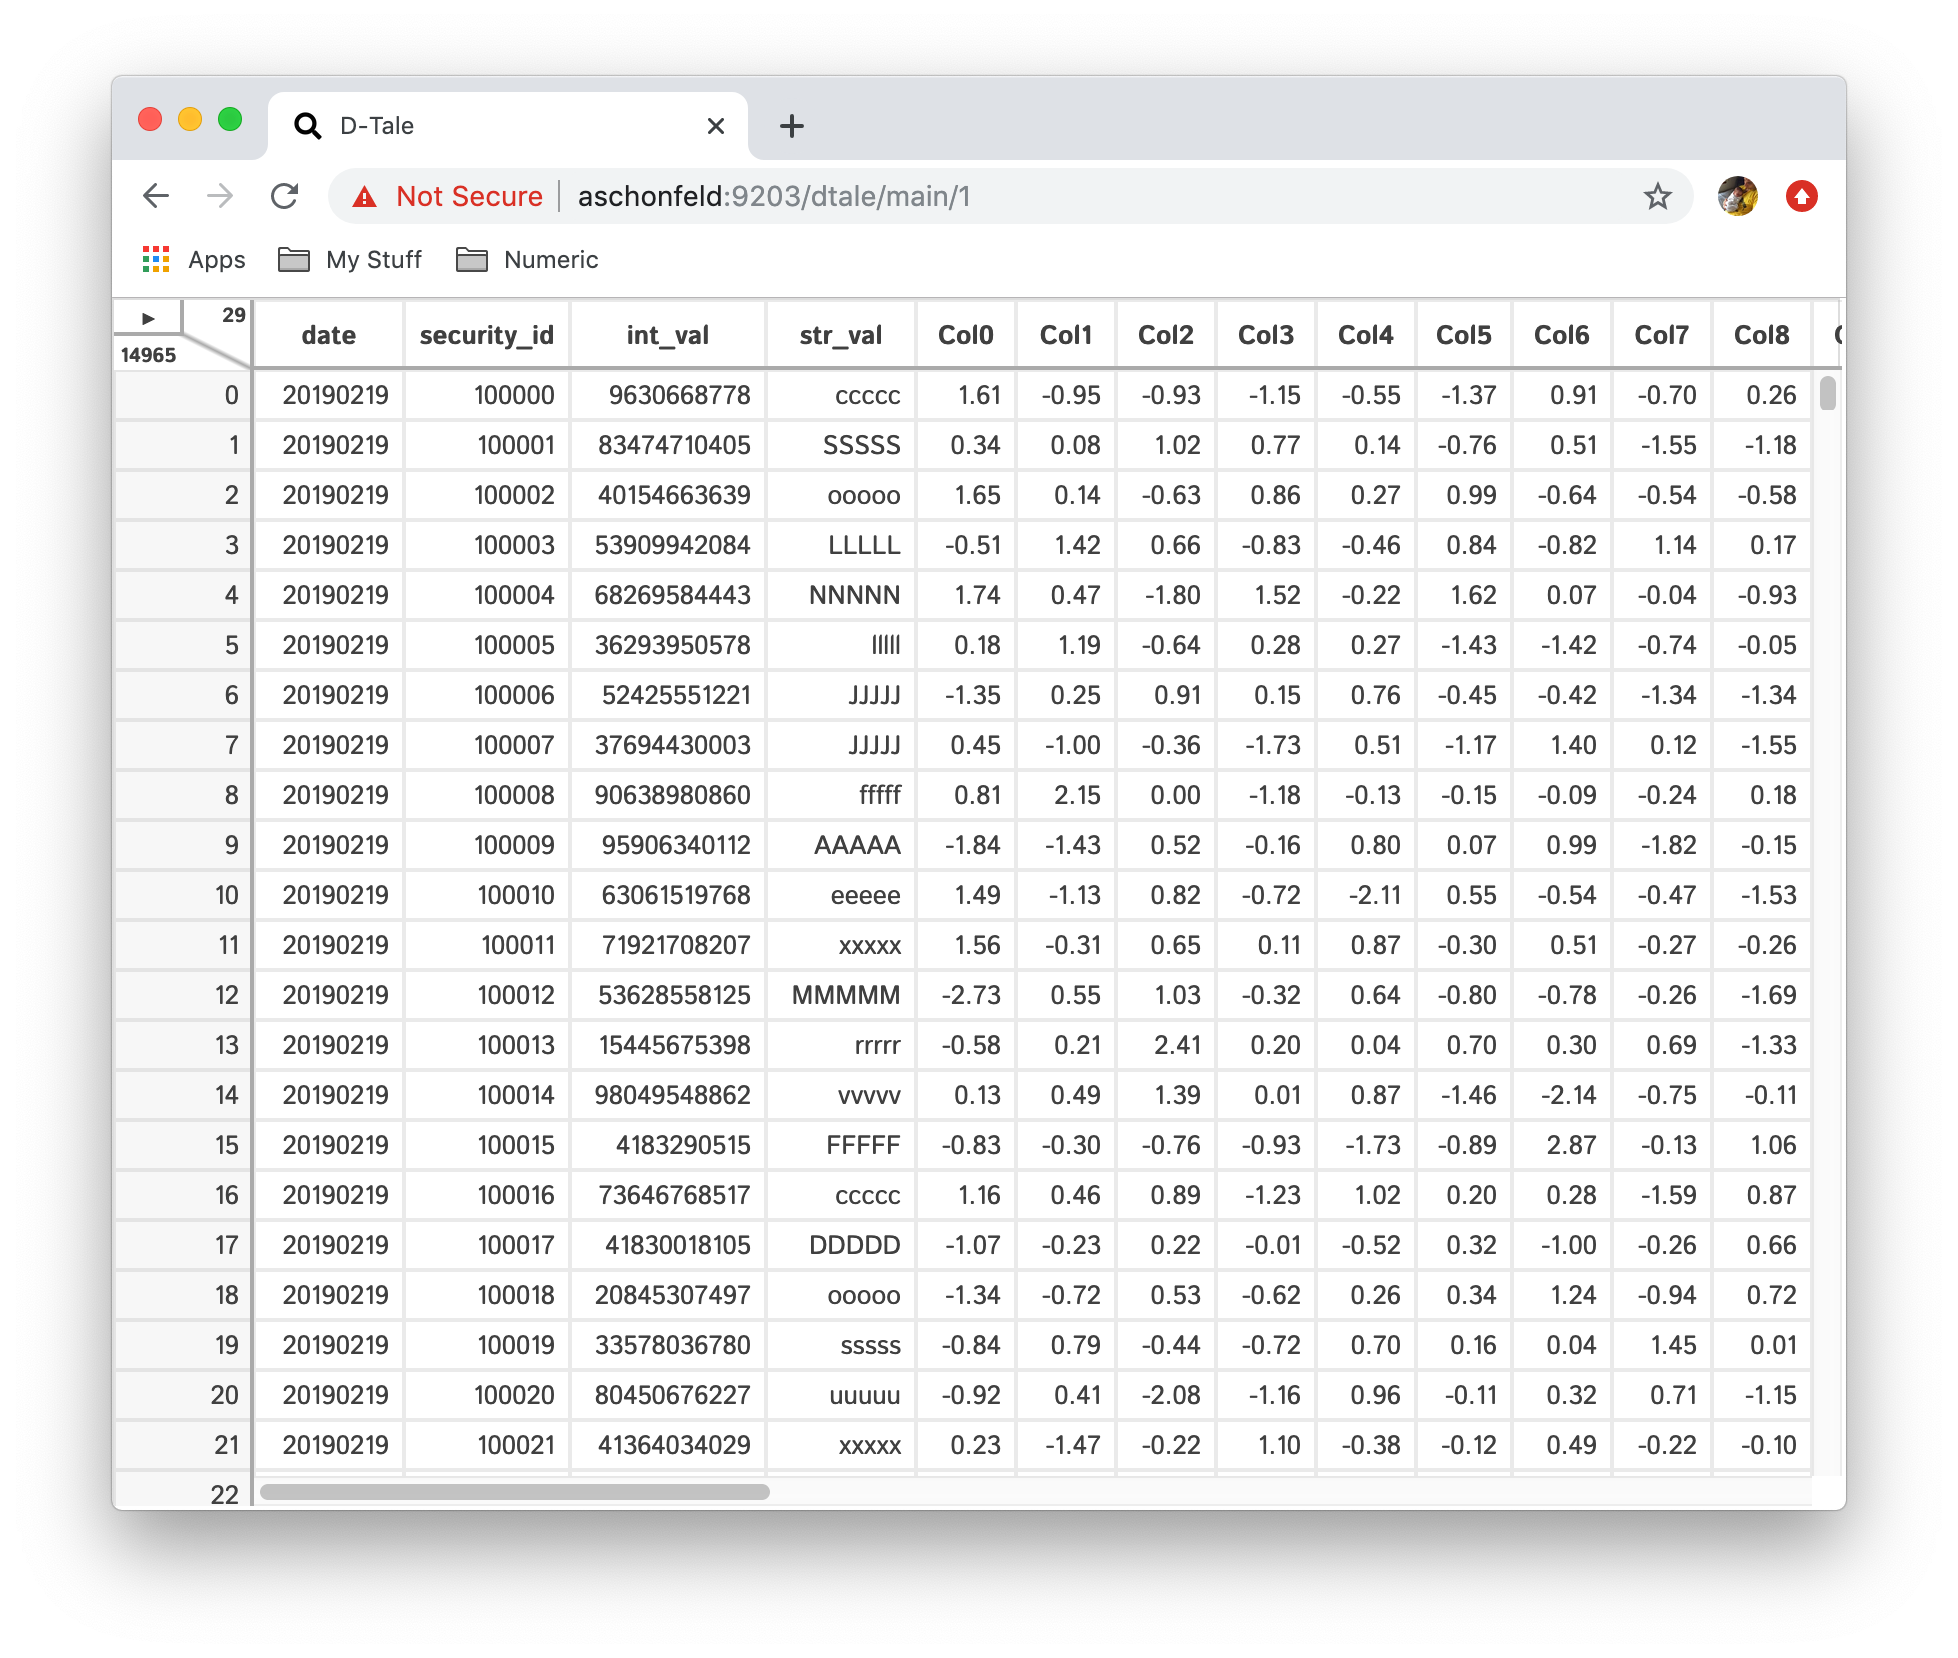
DTALE_CLI_LOADERS=./path_to_loaders bash -c 'dtale --testdata-rows 10 --testdata-columns 5'Once you have kicked off your D-Tale session please copy & paste the link on the last line of output in your browser
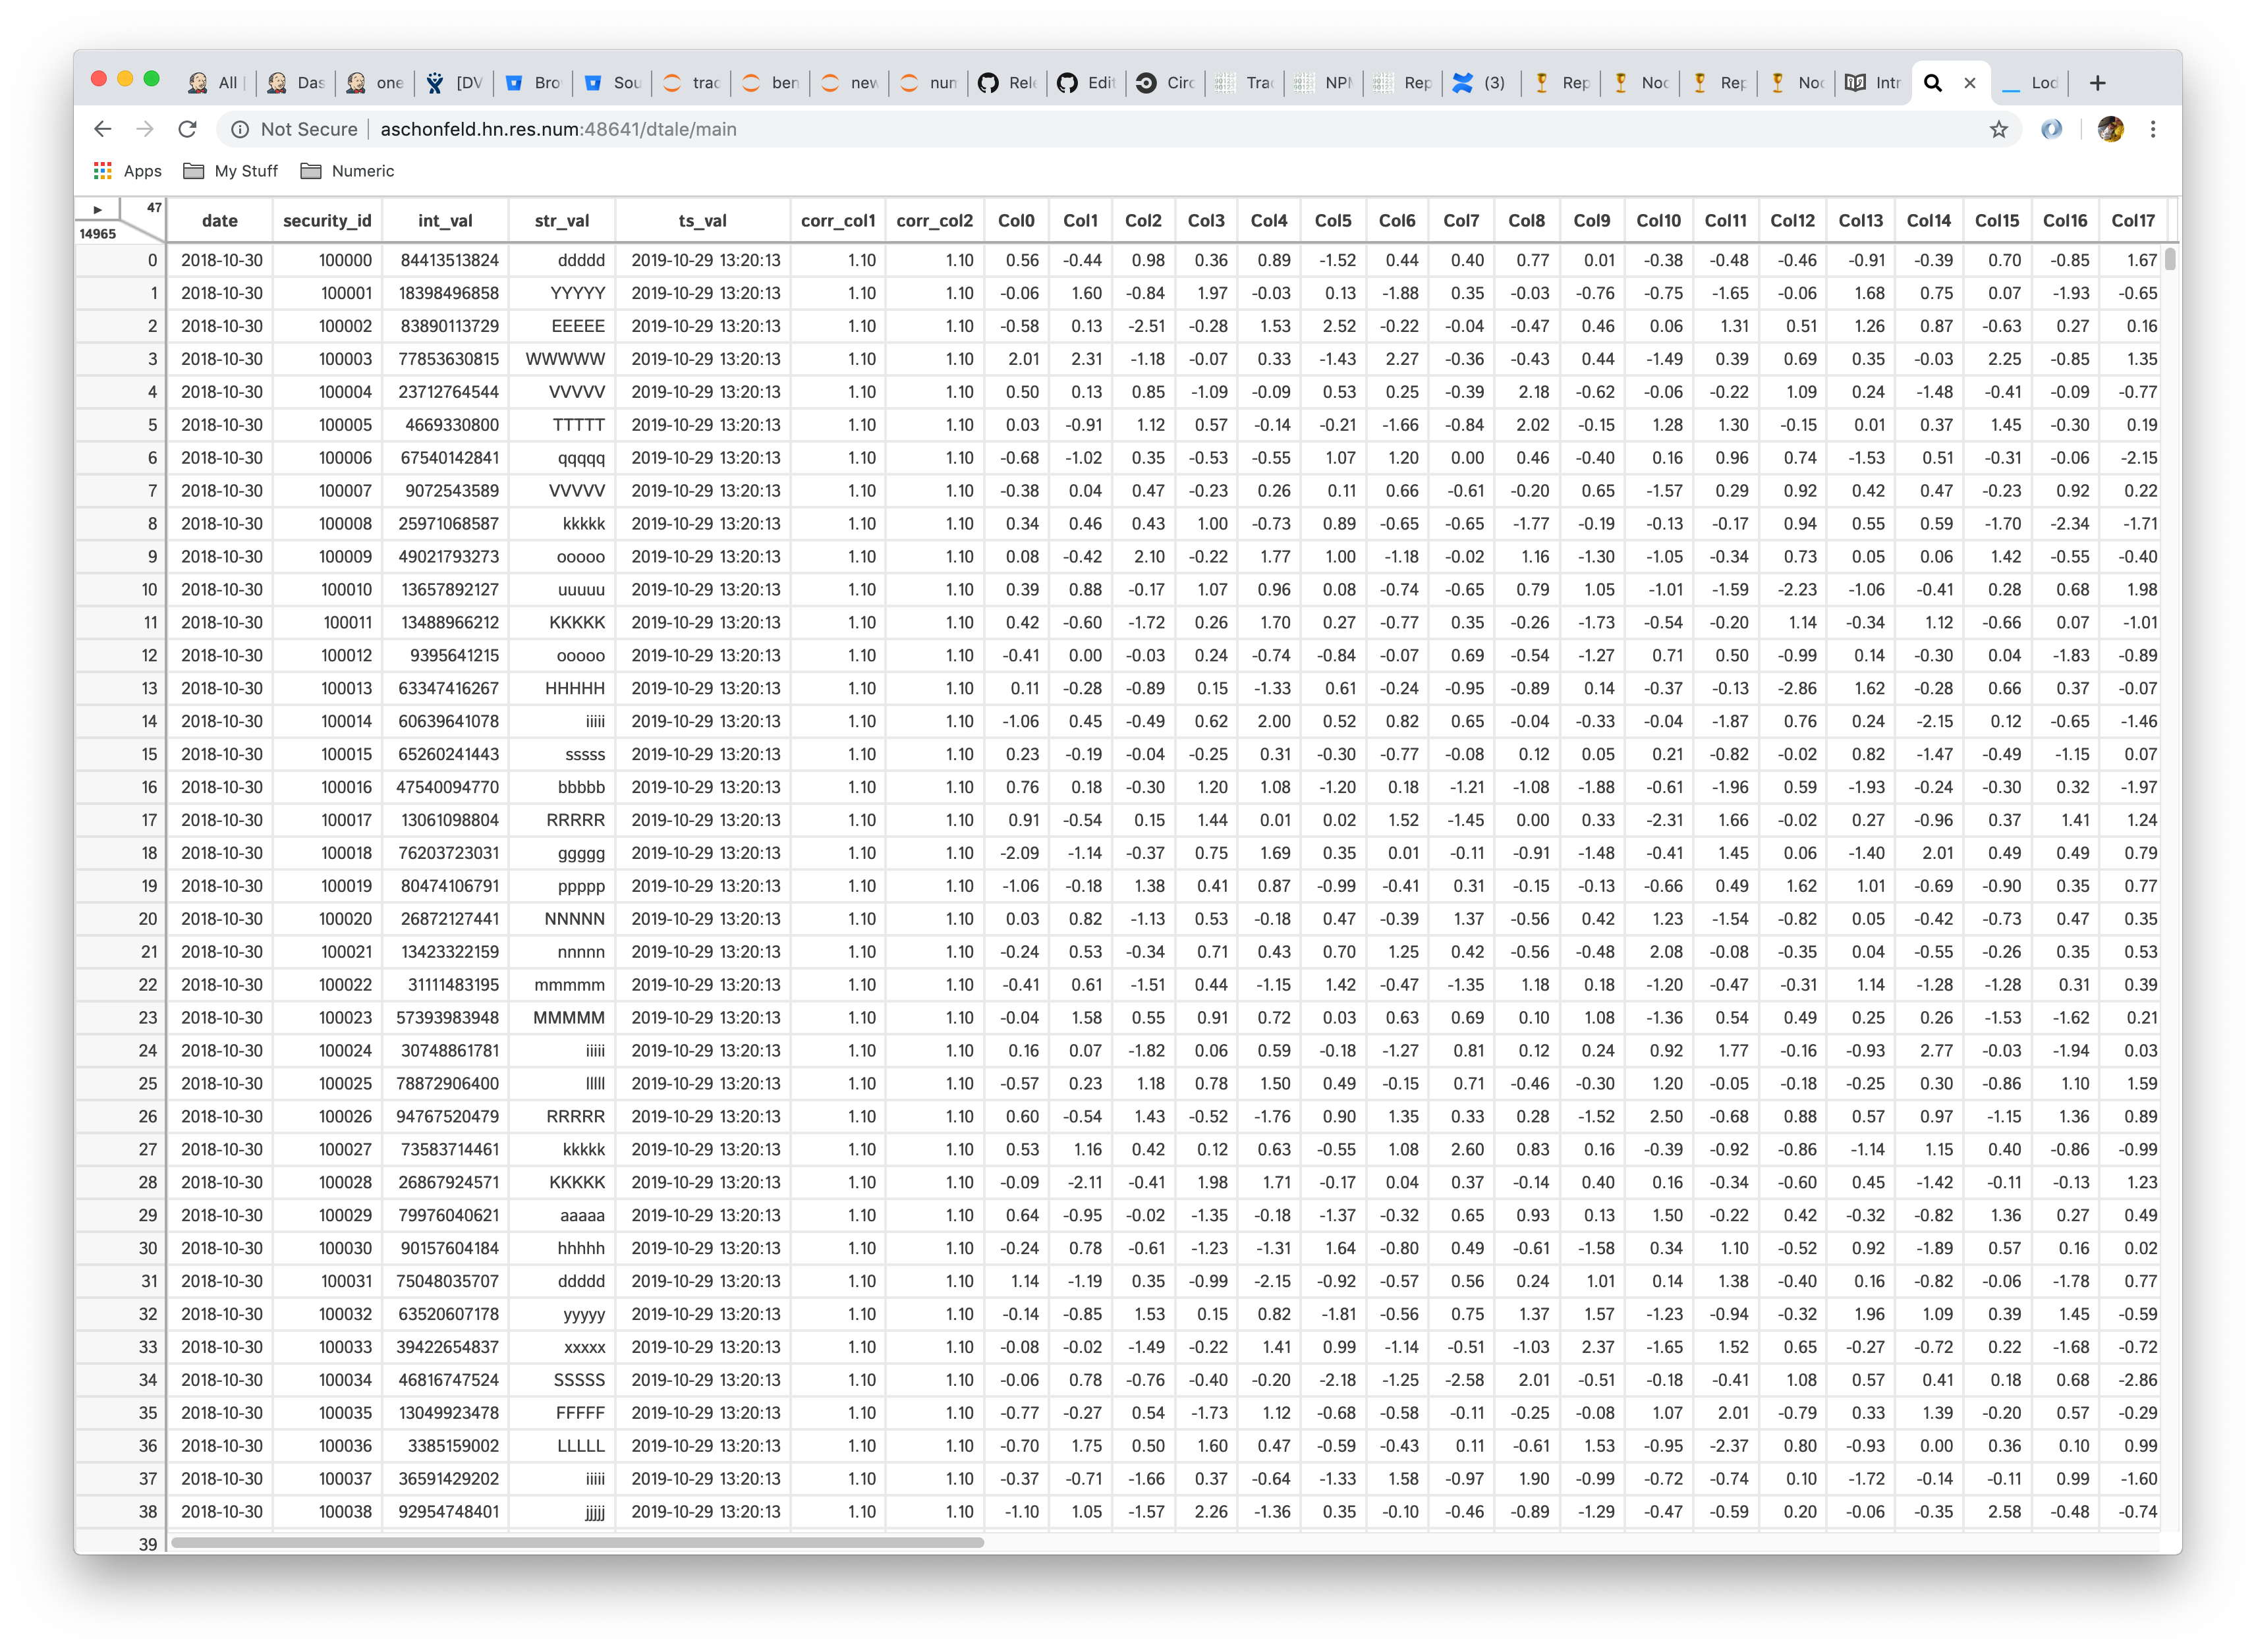
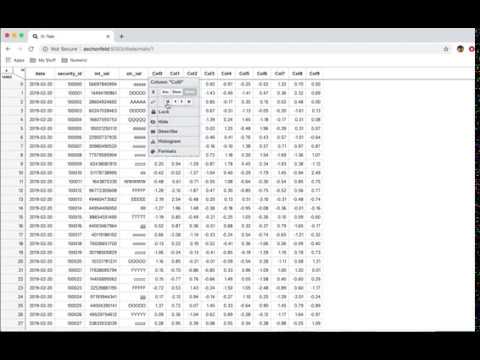
The information in the upper right-hand corner gives grid dimensions 
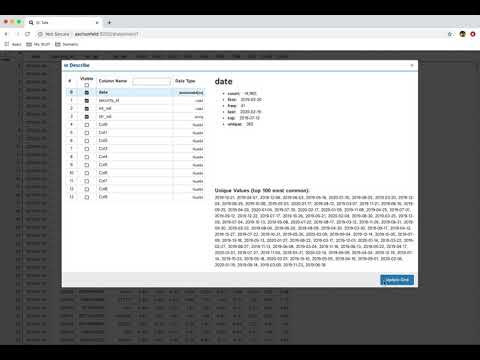
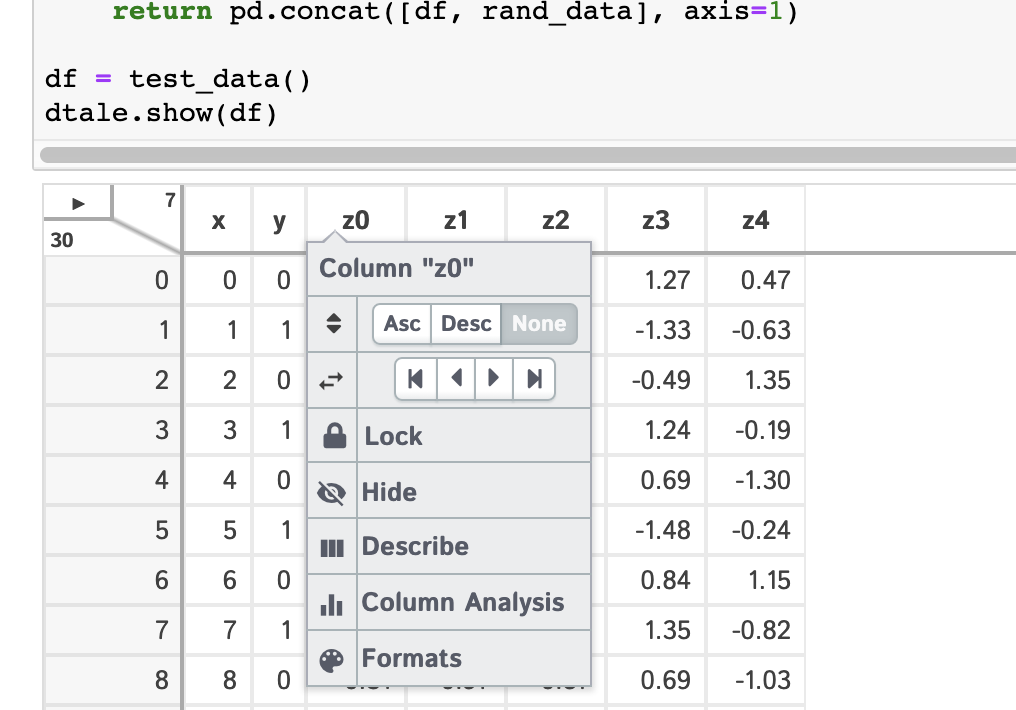
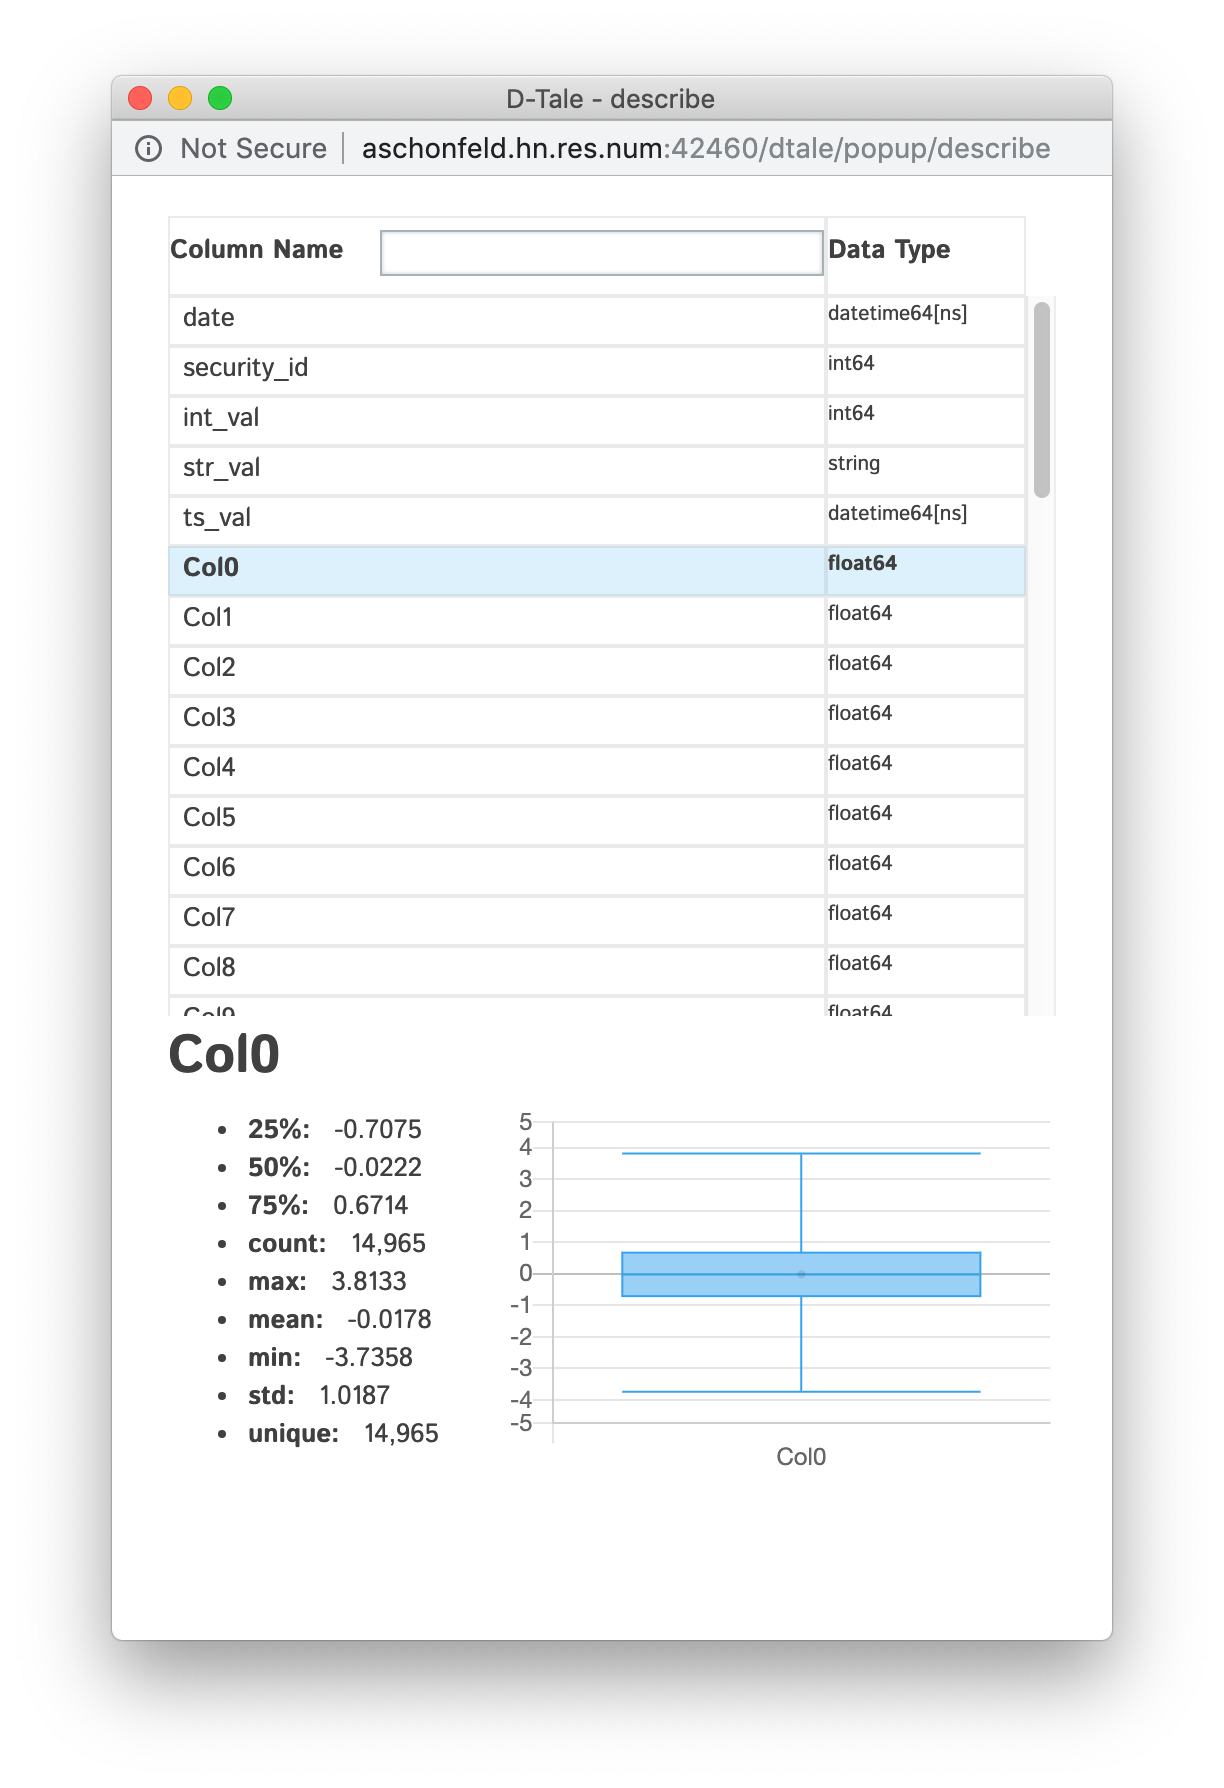
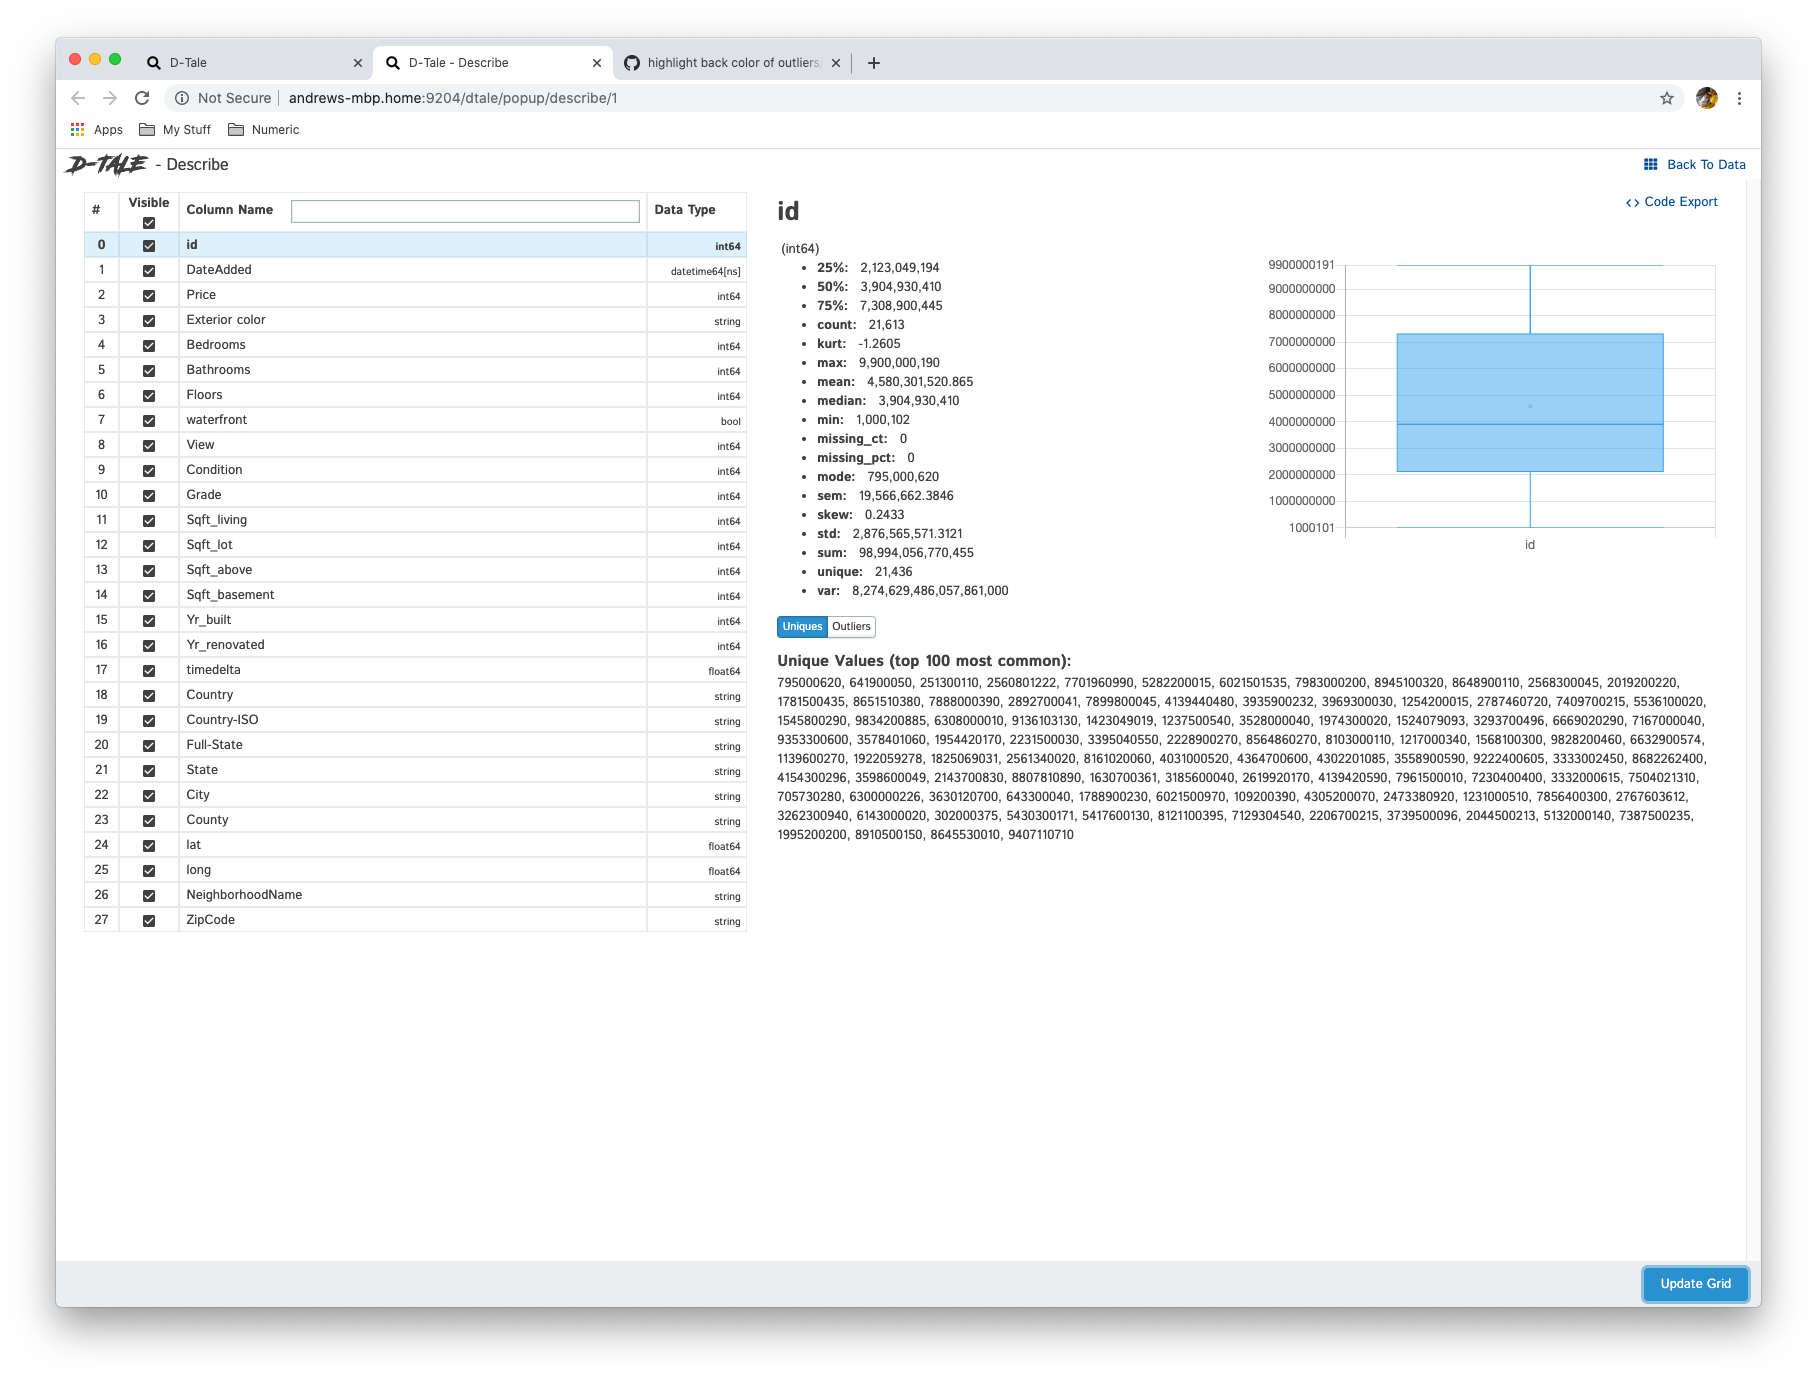
View all the columns & their data types as well as individual details of each column
| Data Type | Display | Notes |
|---|---|---|
| date | 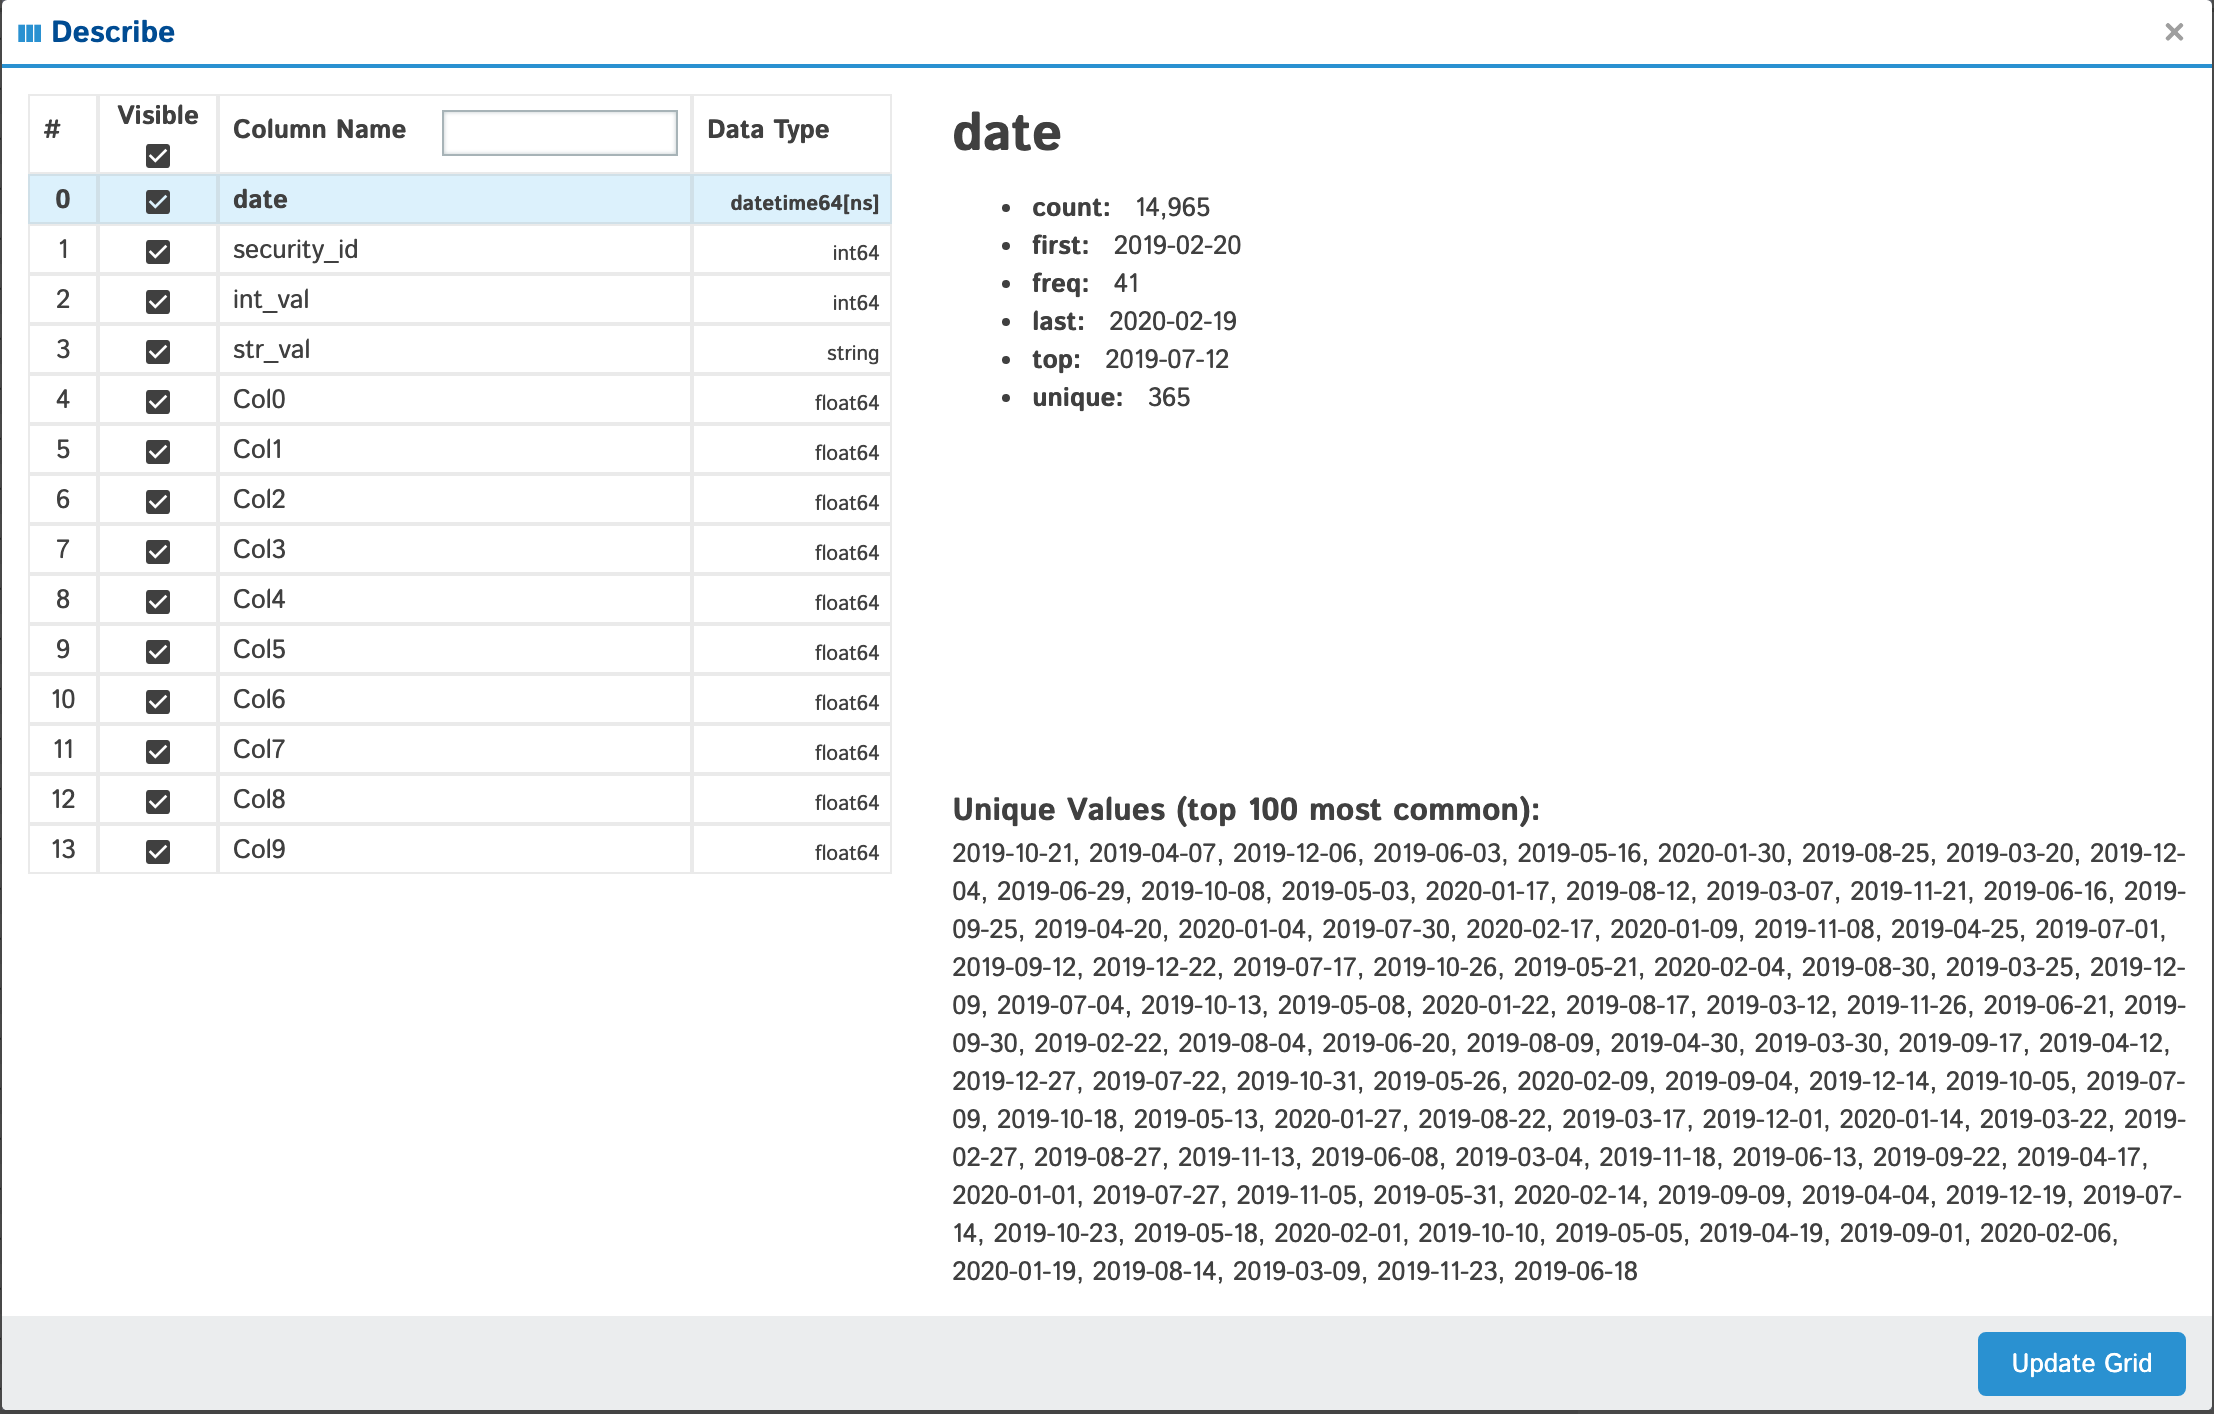 |
|
| string |  |
If you have less than or equal to 100 unique values they will be displayed at the bottom of your popup |
| int | 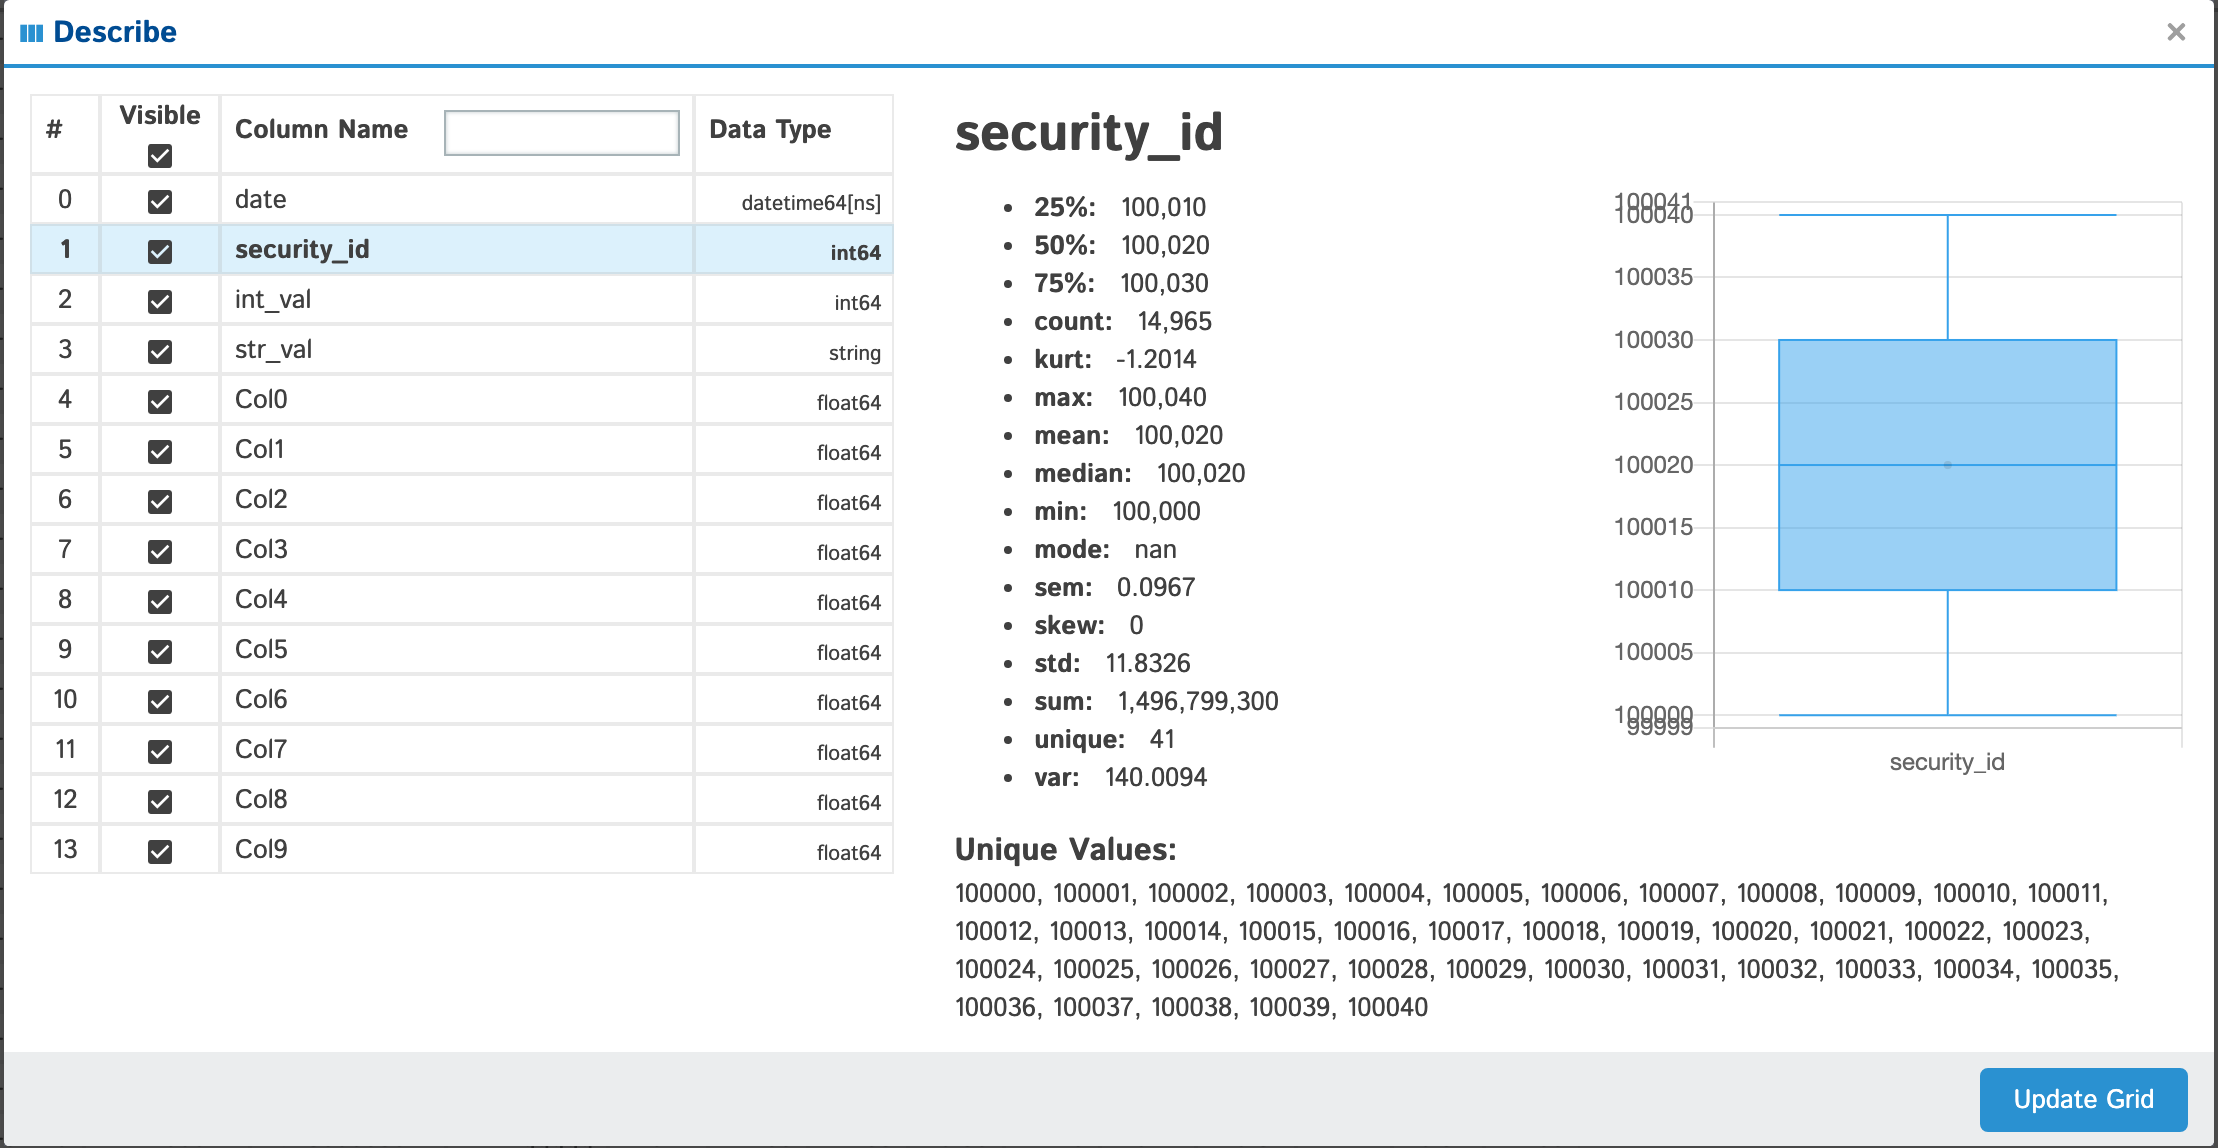 |
Anything with standard numeric classifications (min, max, 25%, 50%, 75%) will have a nice boxplot with the mean (if it exists) displayed as an outlier if you look closely. |
| float | 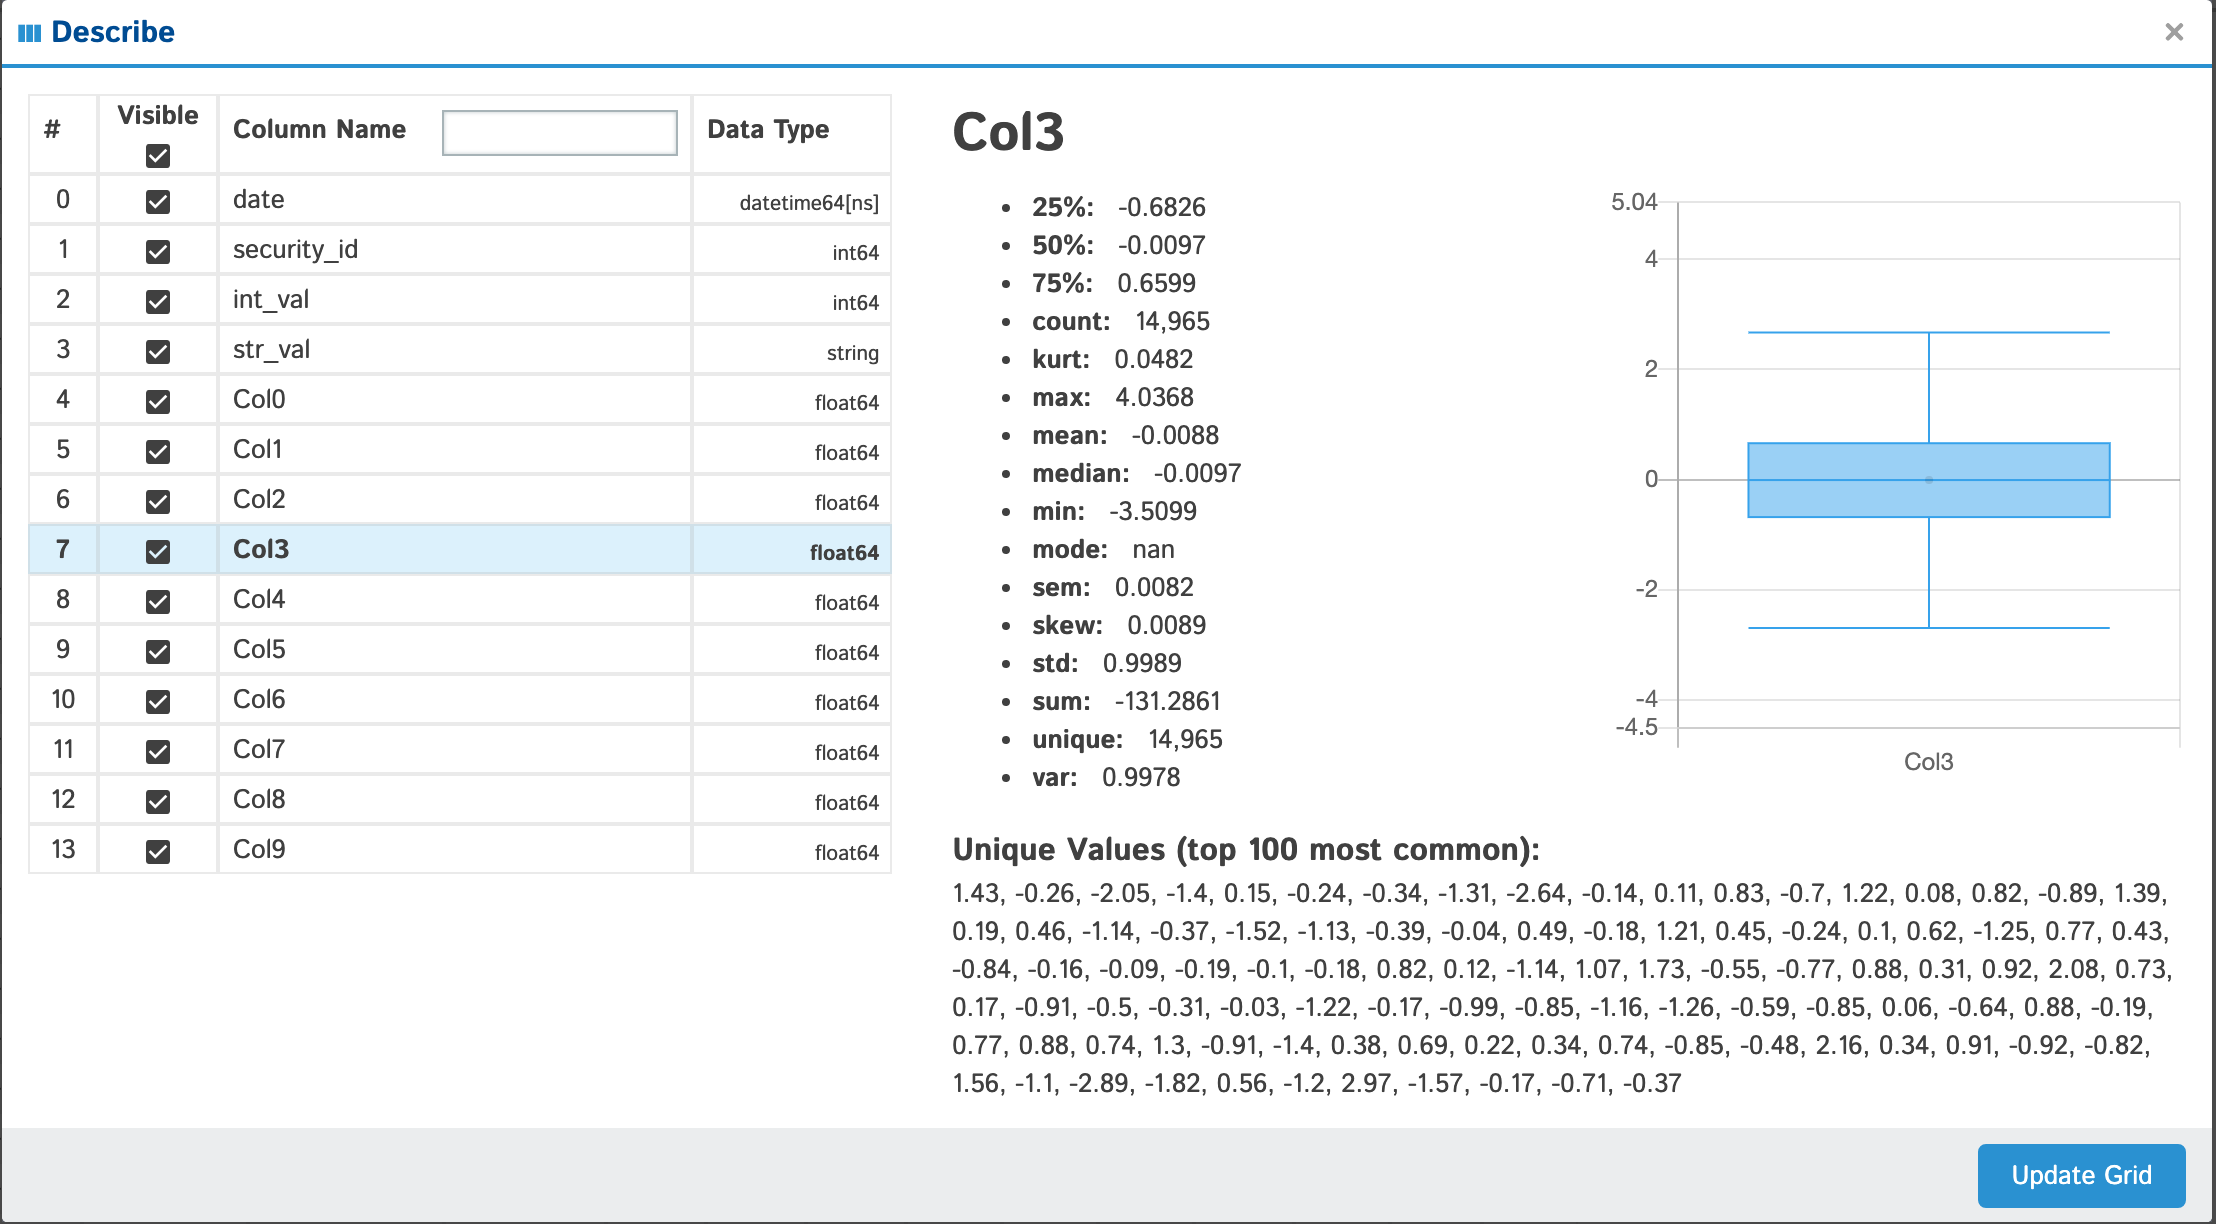 |
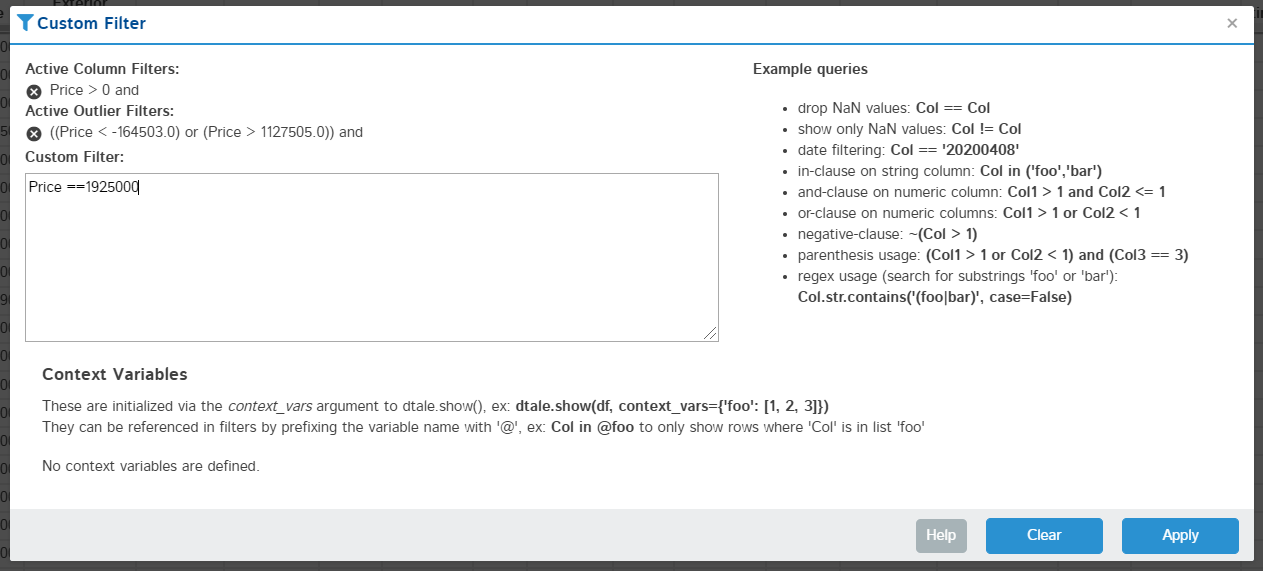
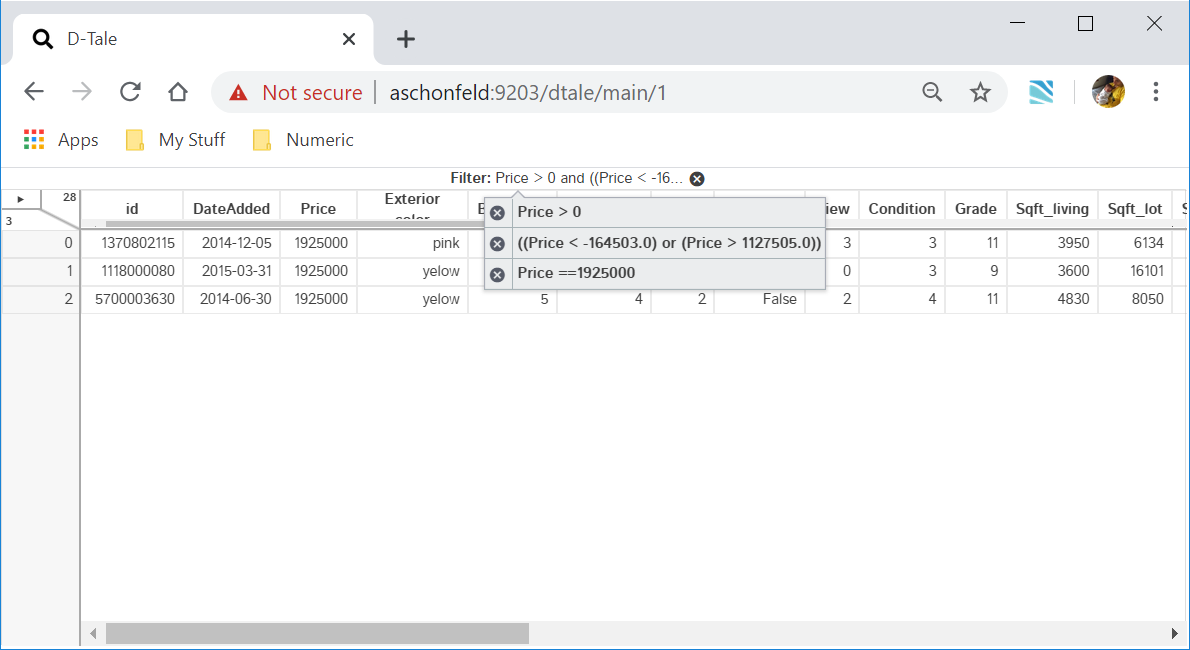
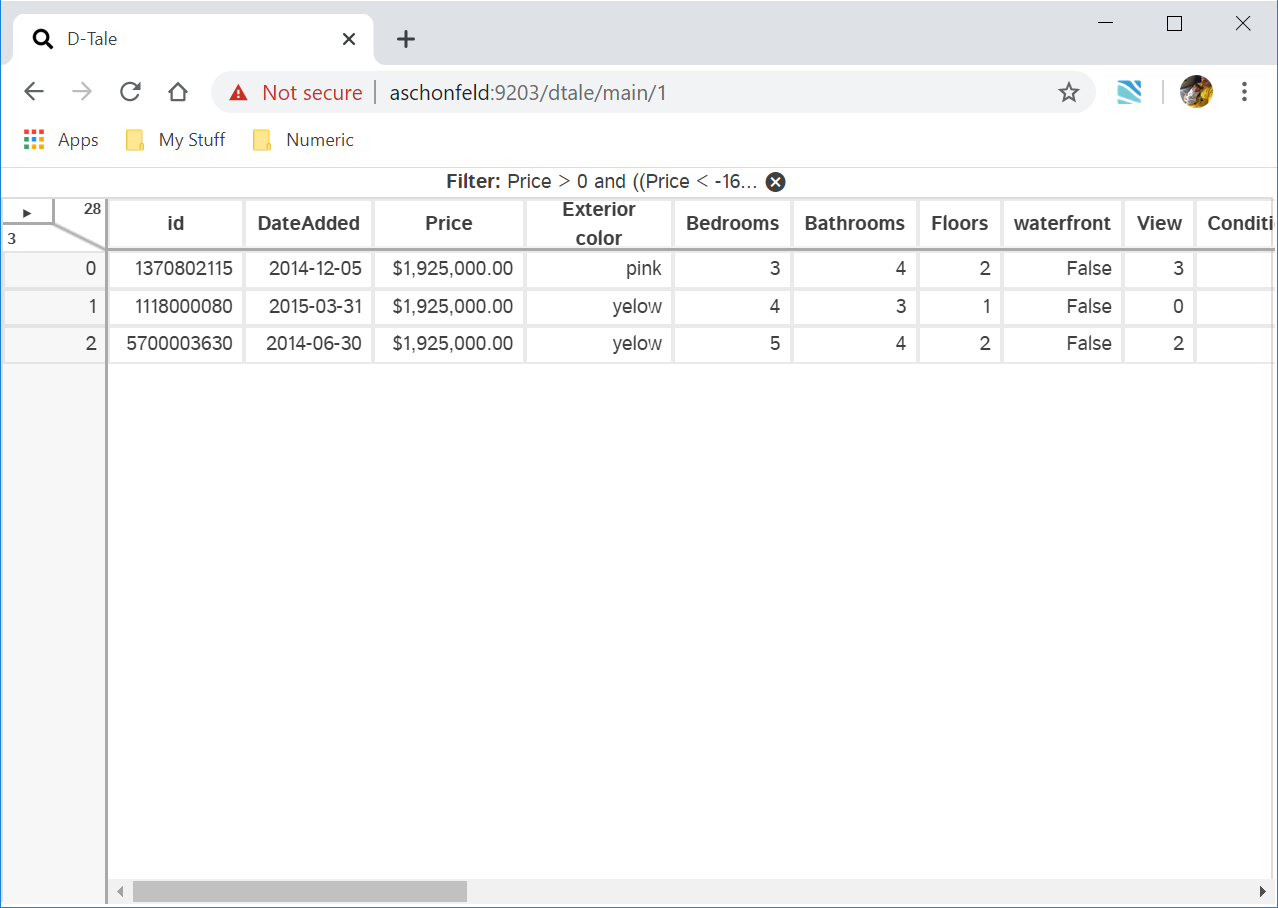
Apply a simple pandas query to your data (link to pandas documentation included in popup)
Context Variables are user-defined values passed in via the context_variables argument to dtale.show(); they can be referenced in filters by prefixing the variable name with '@'.
For example, here is how you can use context variables in a pandas query:
import pandas as pd

df = pd.DataFrame([
  dict(name='Joe', age=7),
  dict(name='Bob', age=23),
  dict(name='Ann', age=45),
  dict(name='Cat', age=88),
])
two_oldest_ages = df['age'].nlargest(2)
df.query('age in @two_oldest_ages')
And here is how you would pass that context variable to D-Tale: dtale.show(df, context_variables=dict(two_oldest_ages=two_oldest_ages))
| Editing | Result |
|---|---|
 |
 |
FYI: For python 3 users, there is now support for filtering on column names with special characters in them (EX: 'a.b')
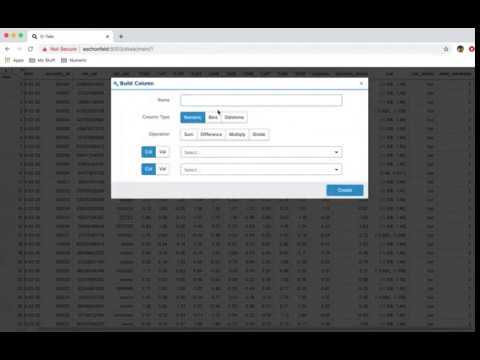
Build custom charts based off your data(powered by plotly/dash).
Here are some examples:
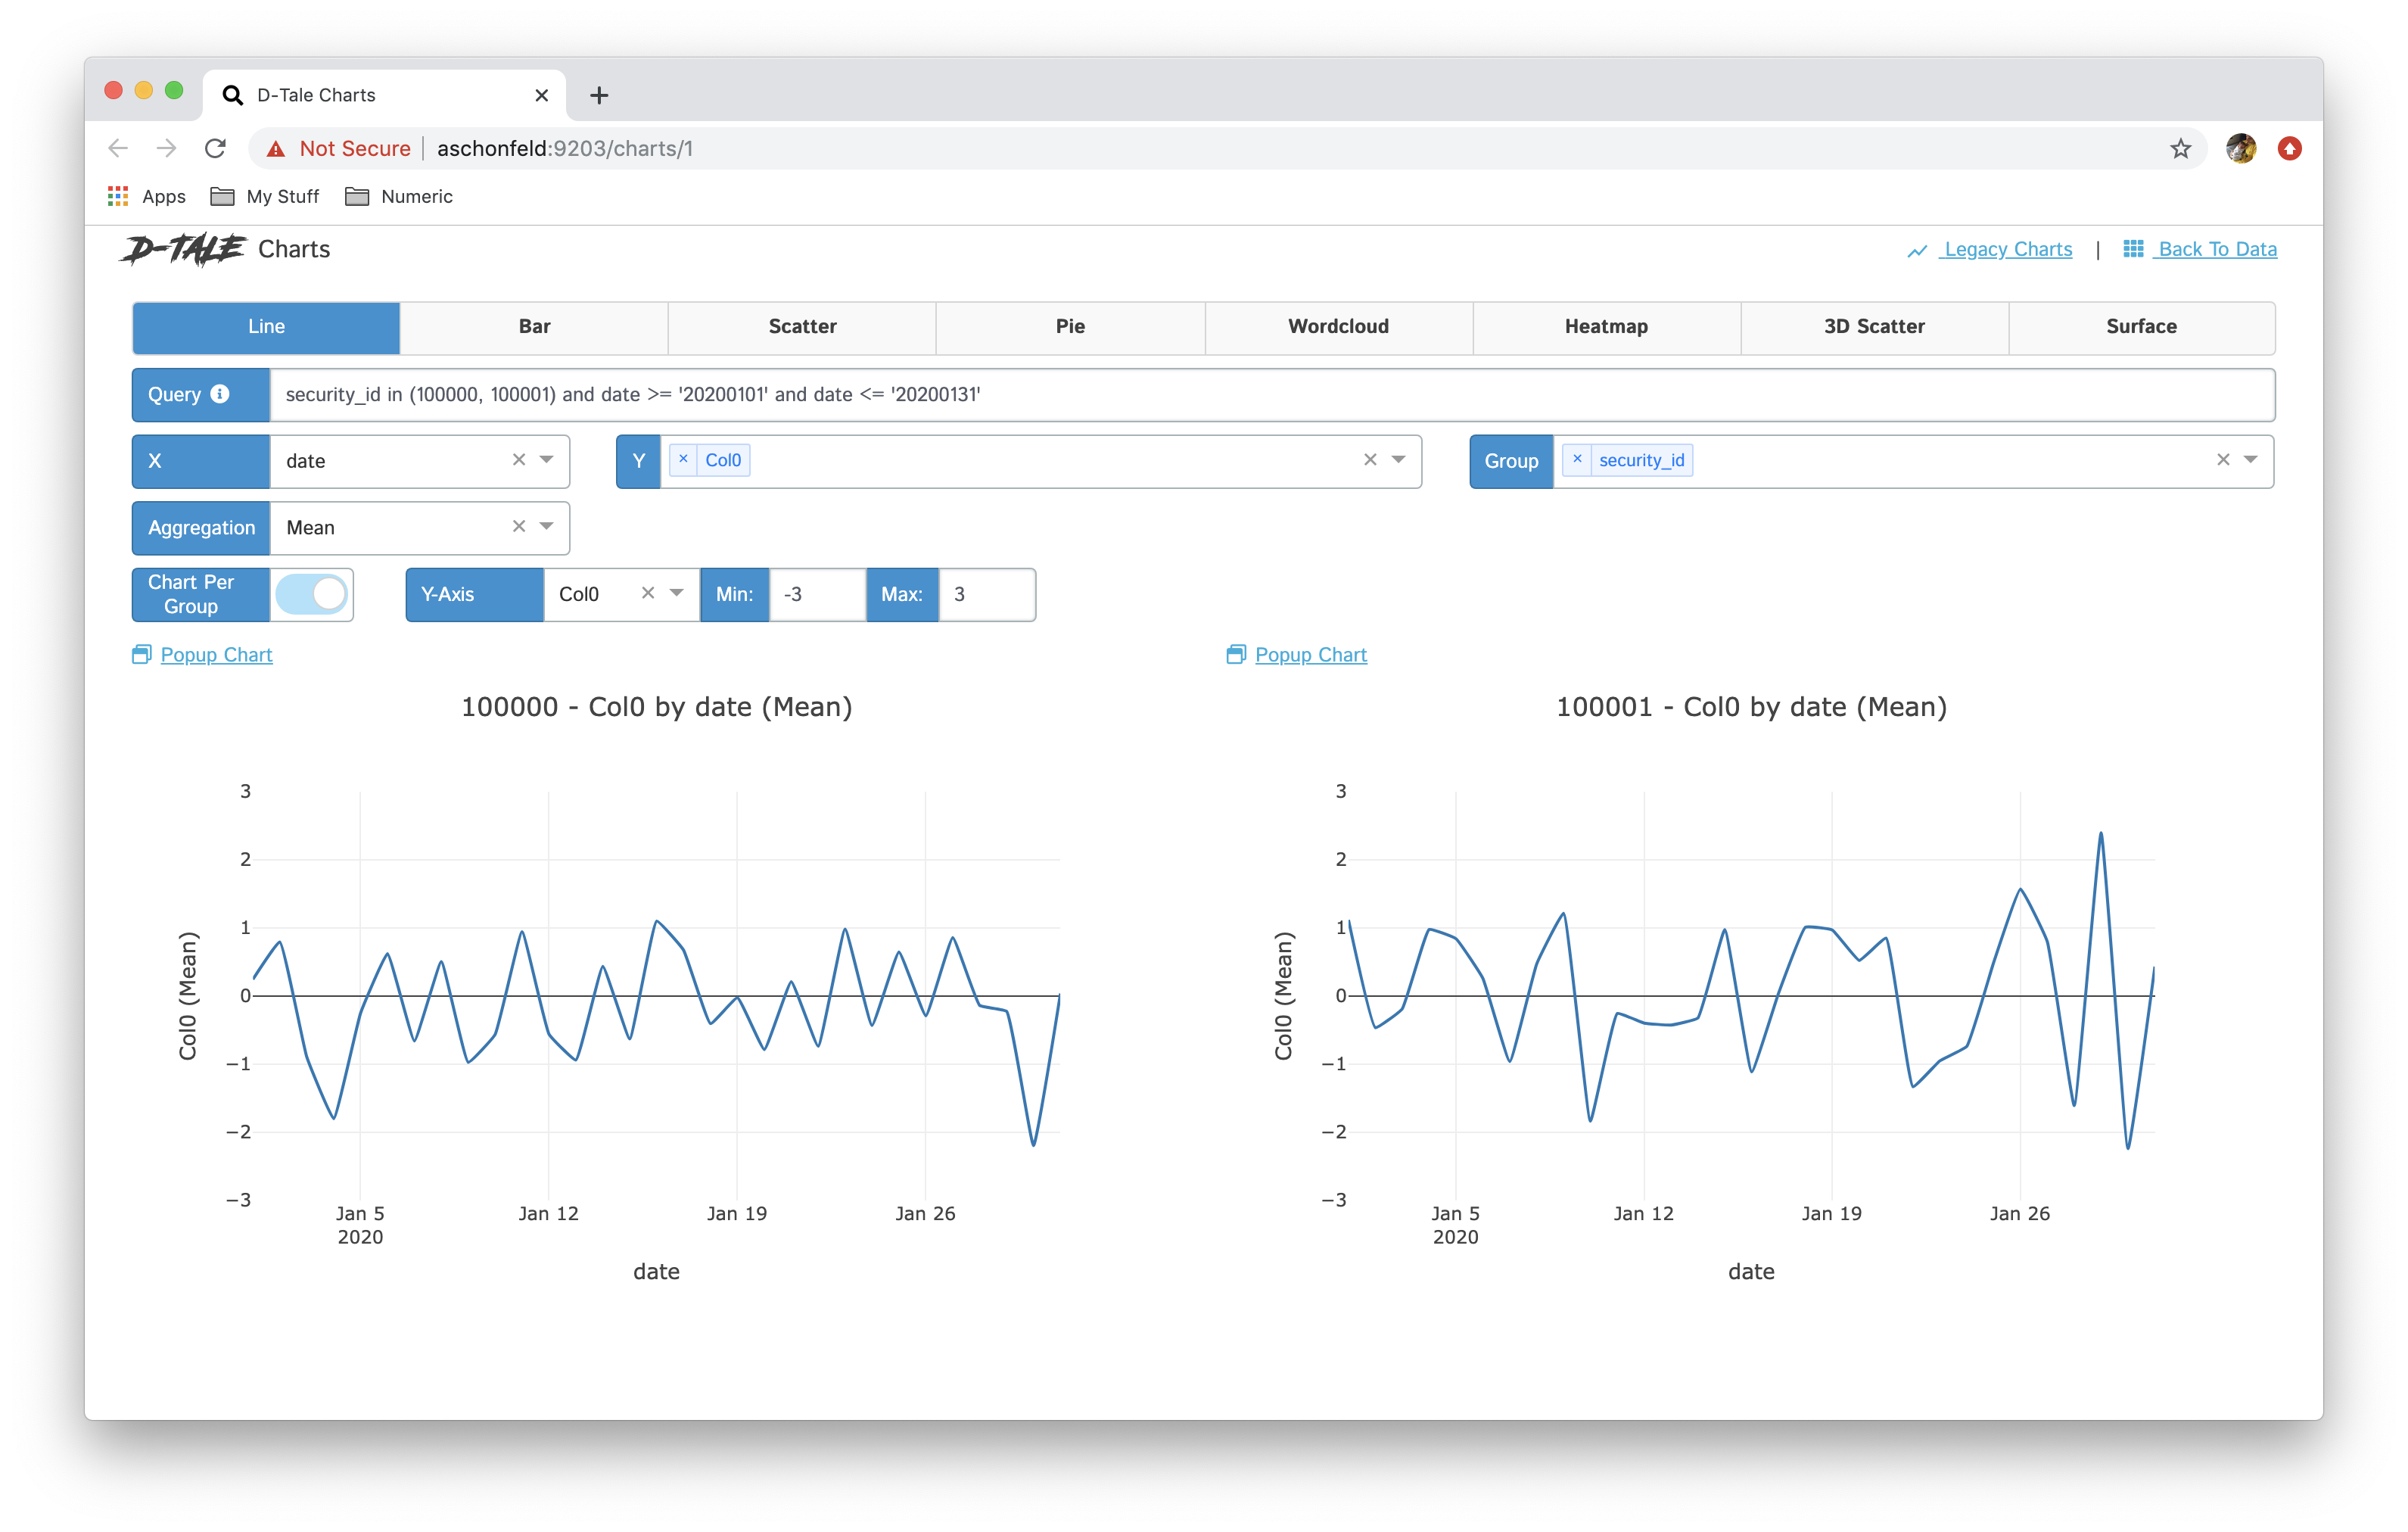
| Chart Type | Chart | Chart per Group |
|---|---|---|
| line | 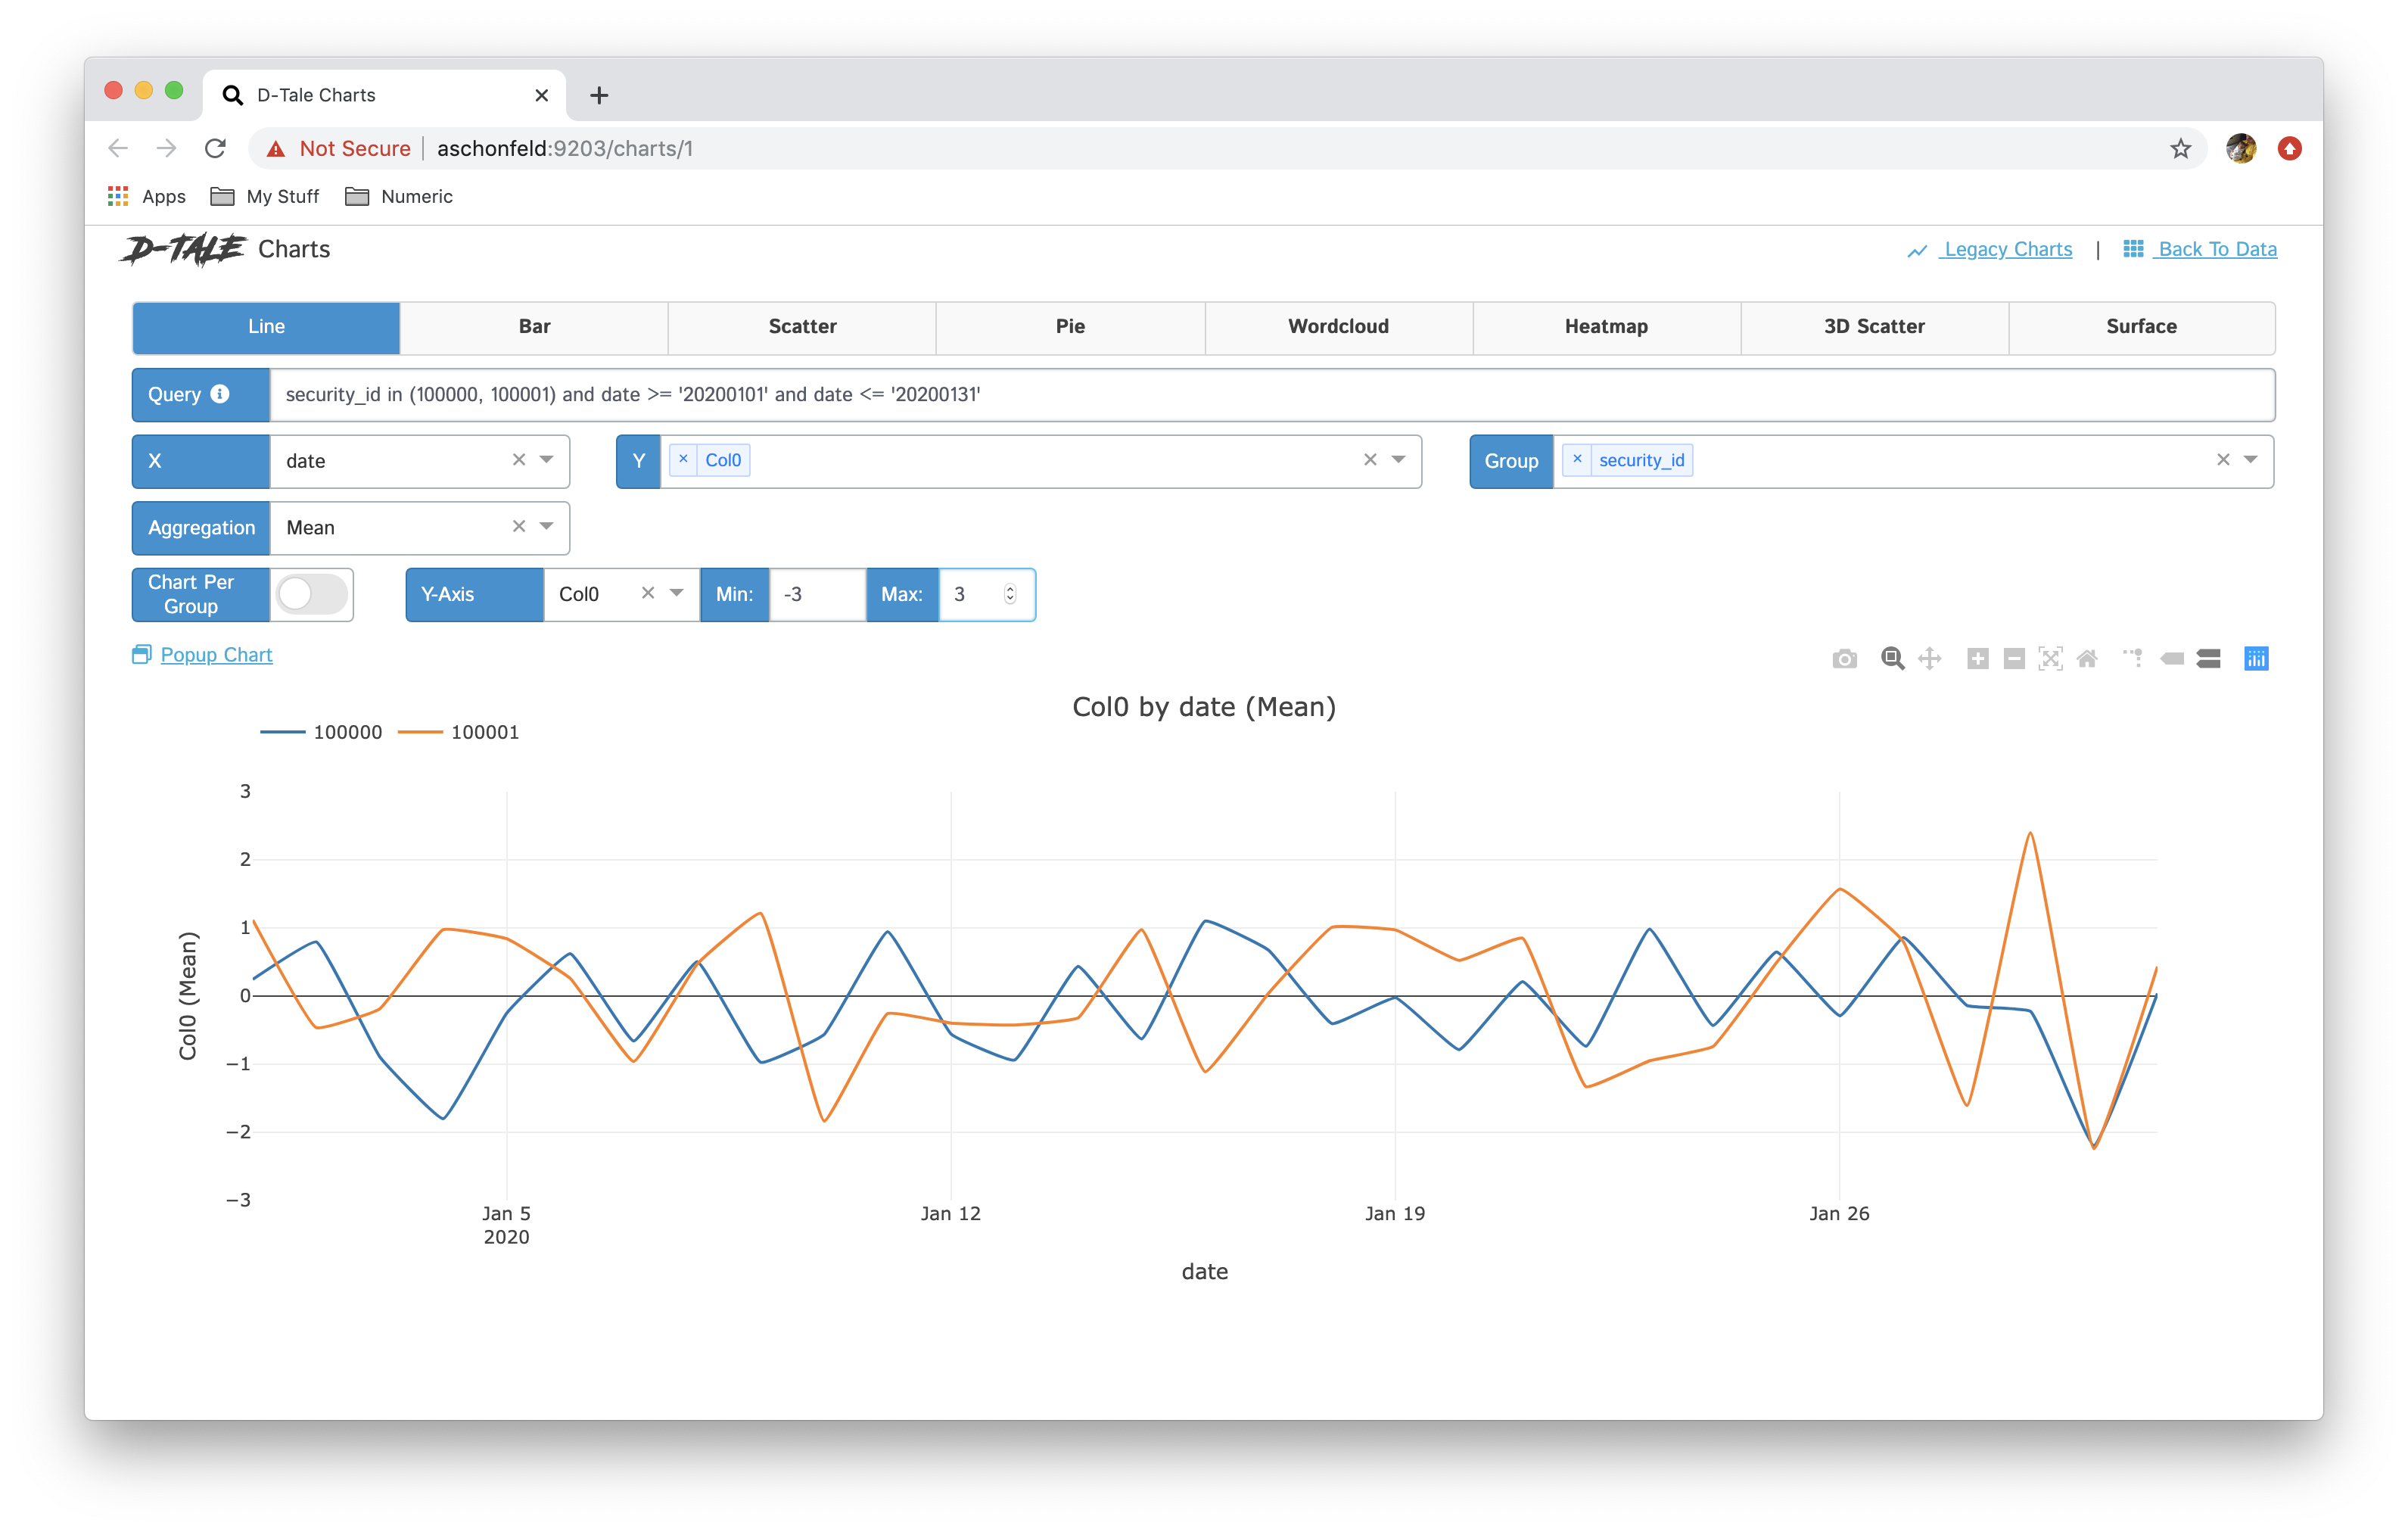 |
 |
| bar | 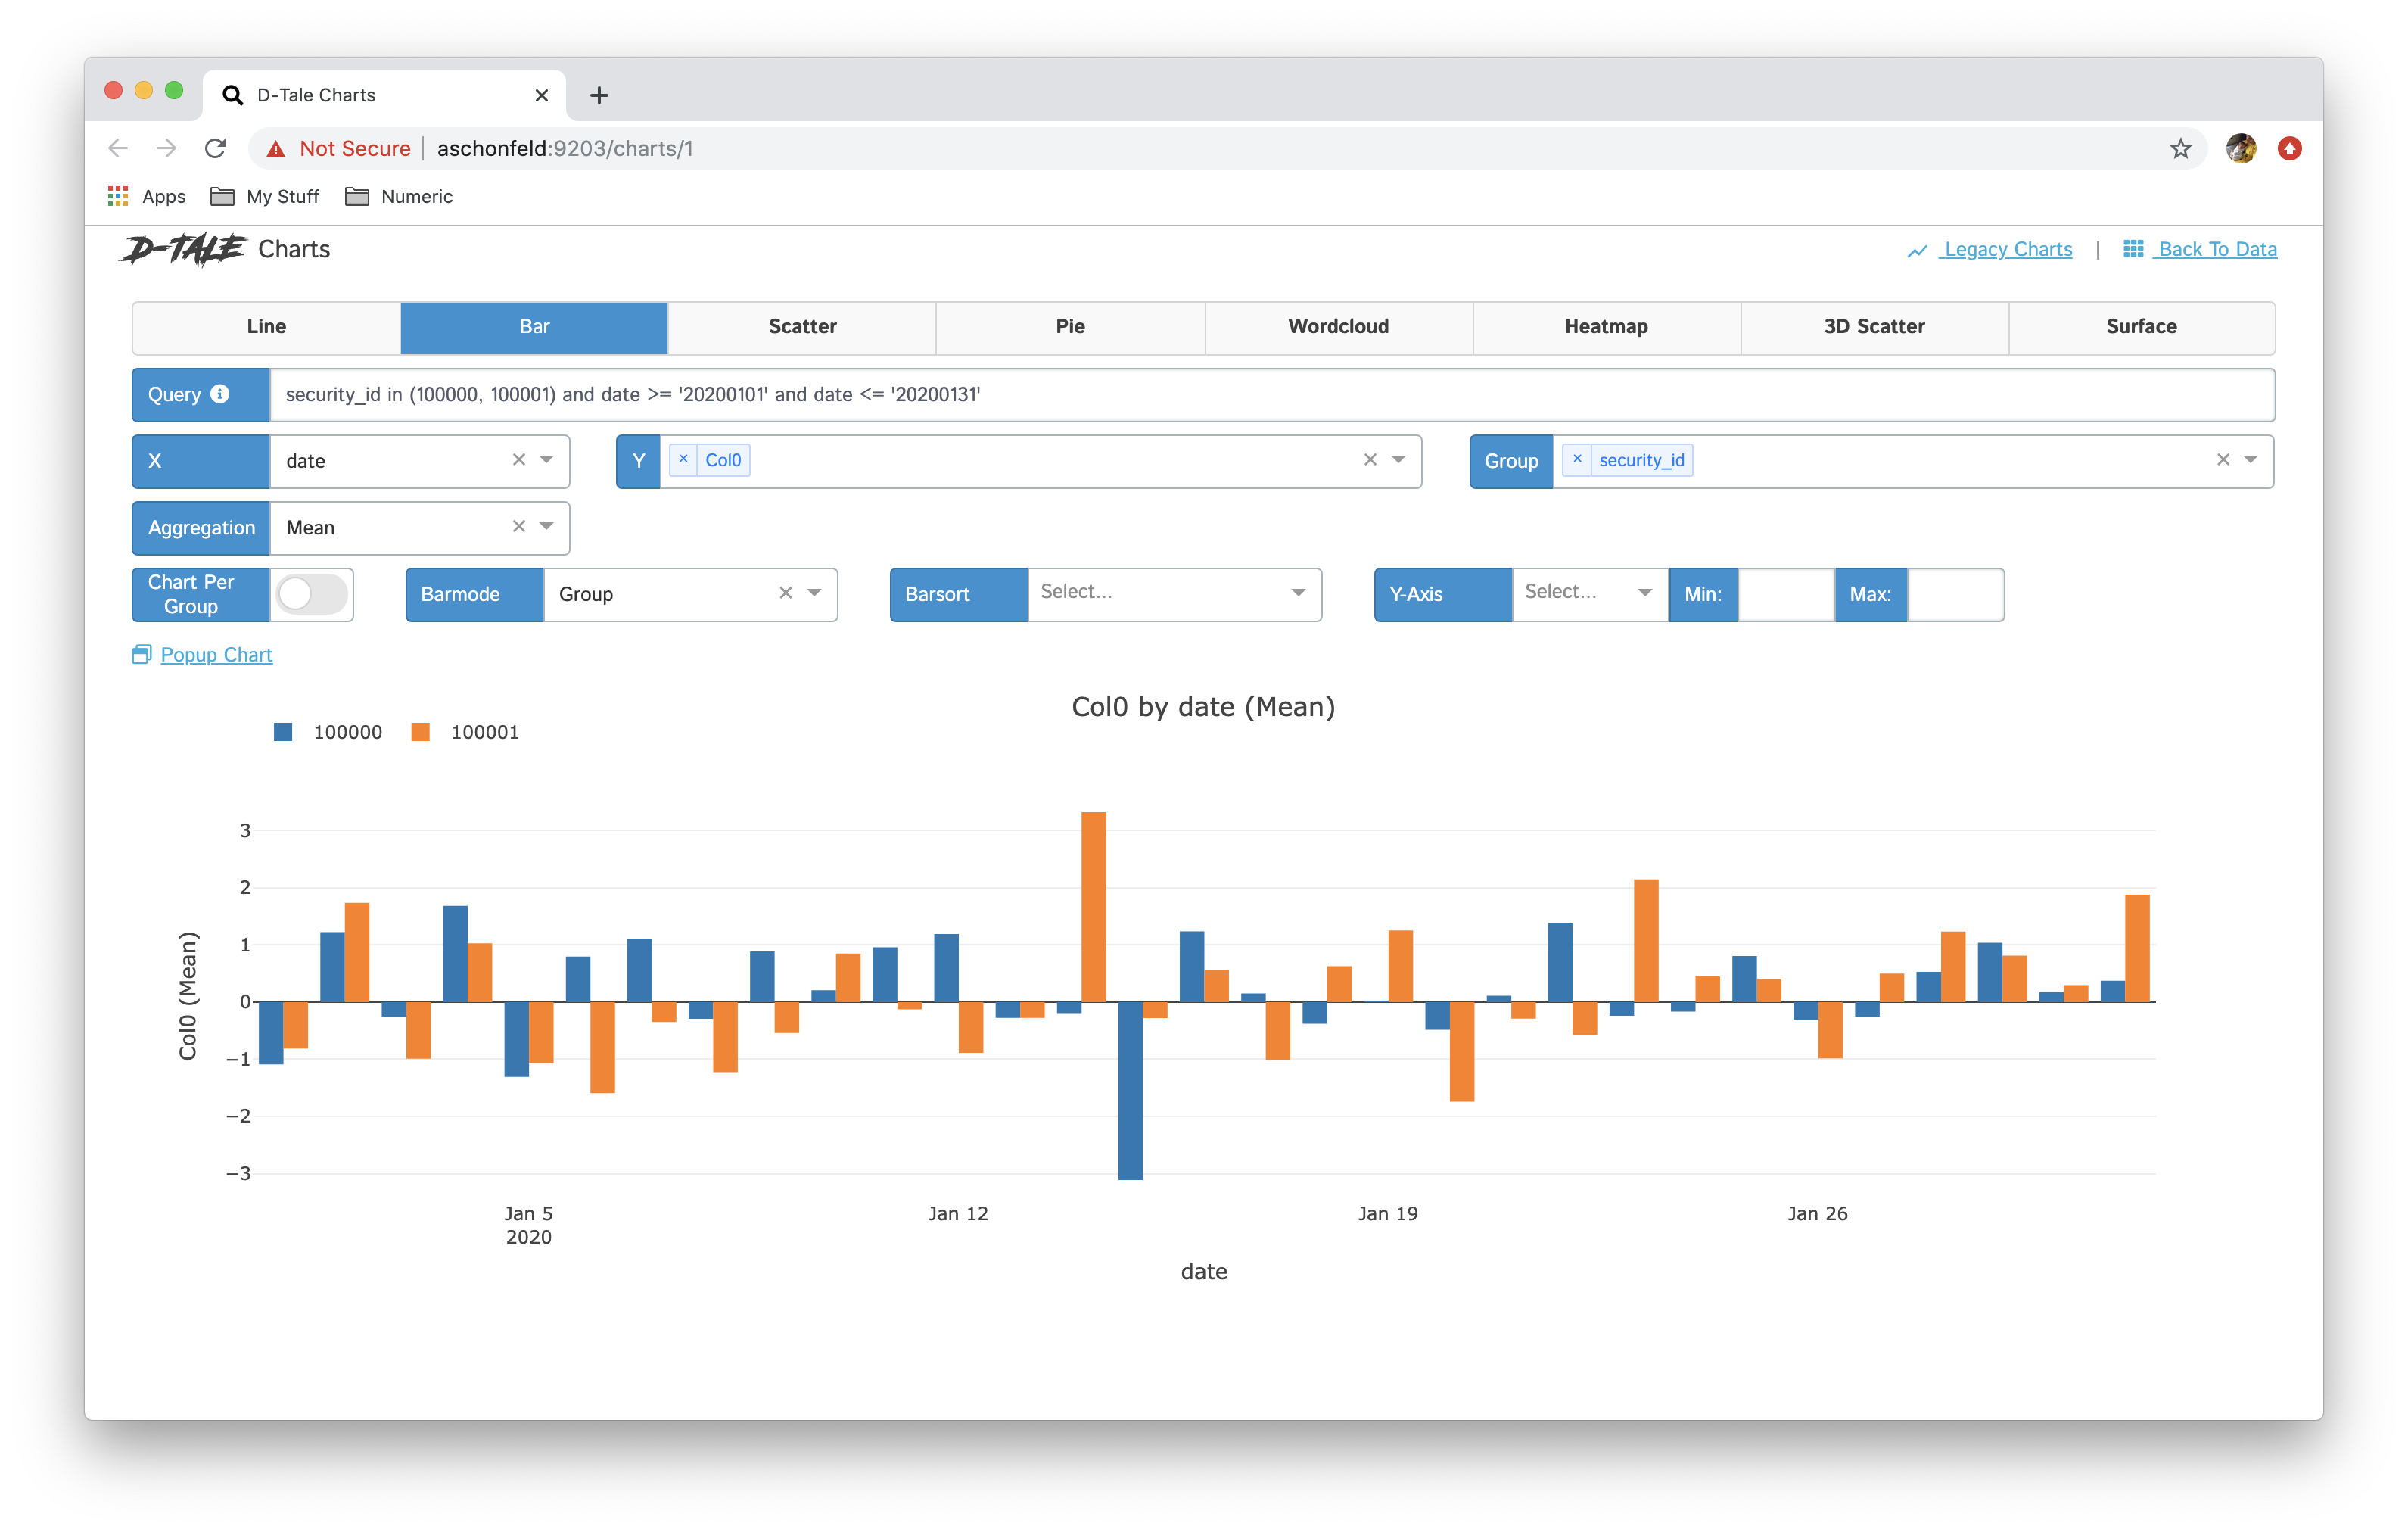 |
 |
| stacked | 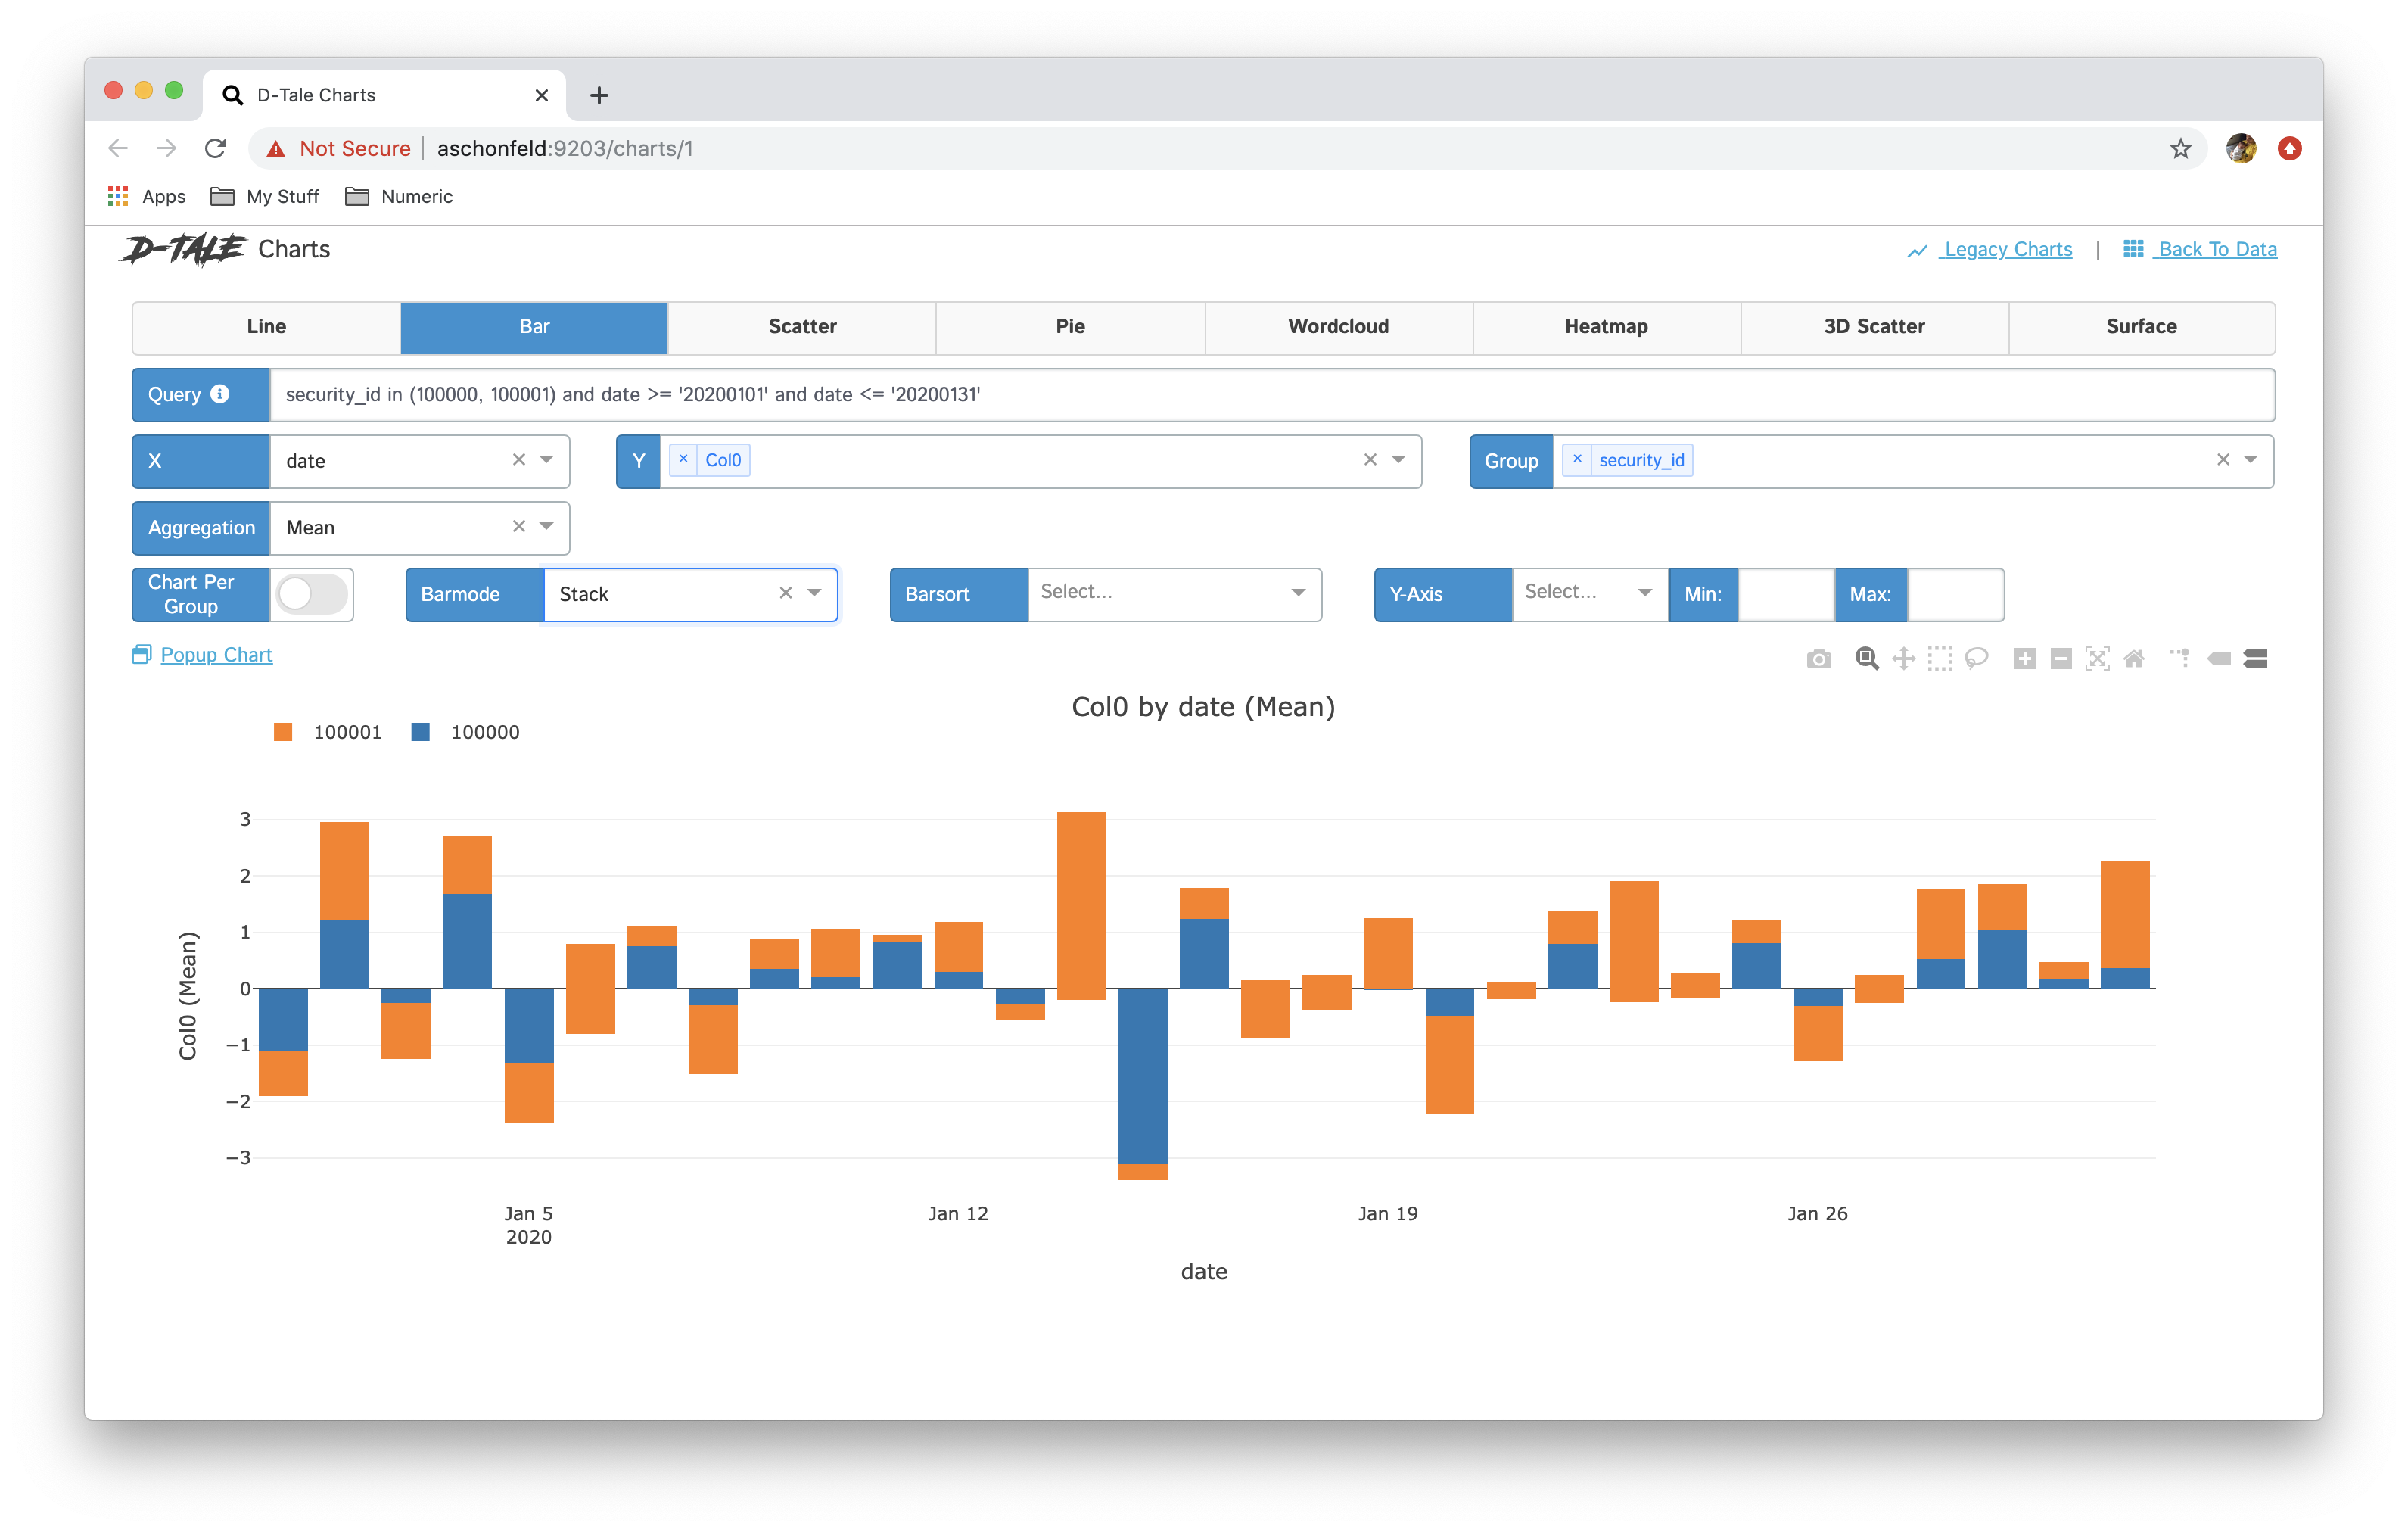 |
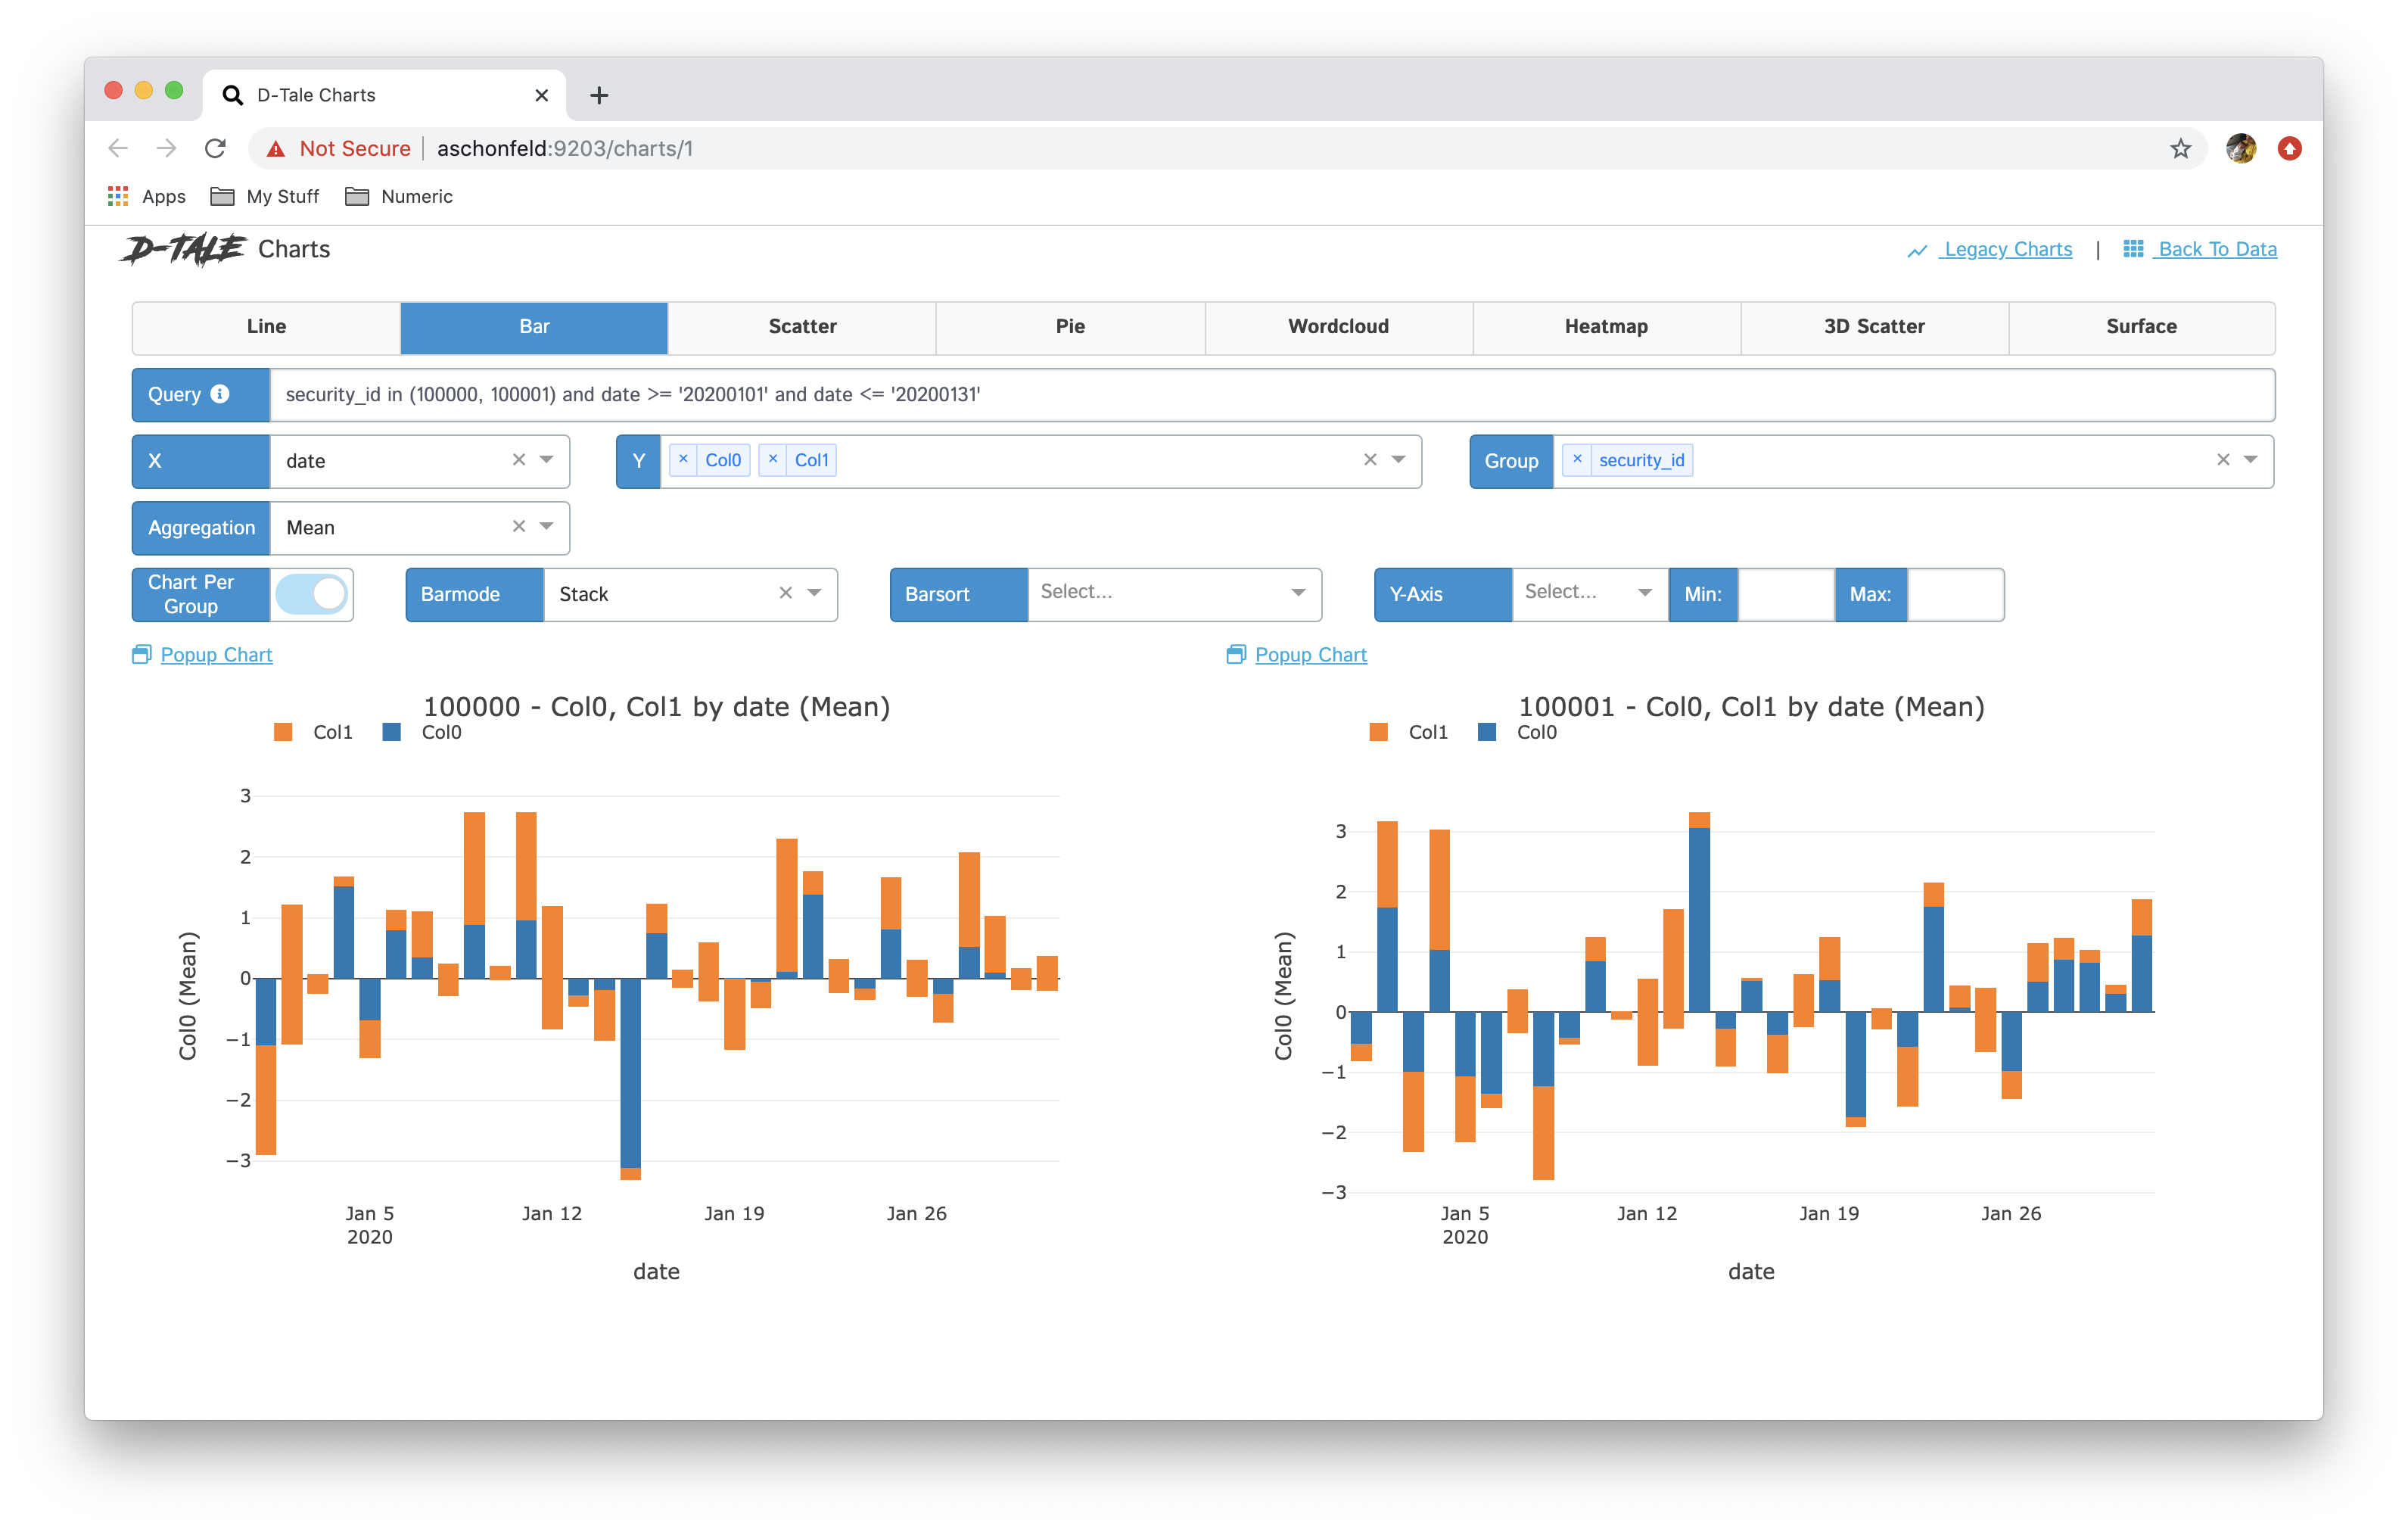 |
| pie | 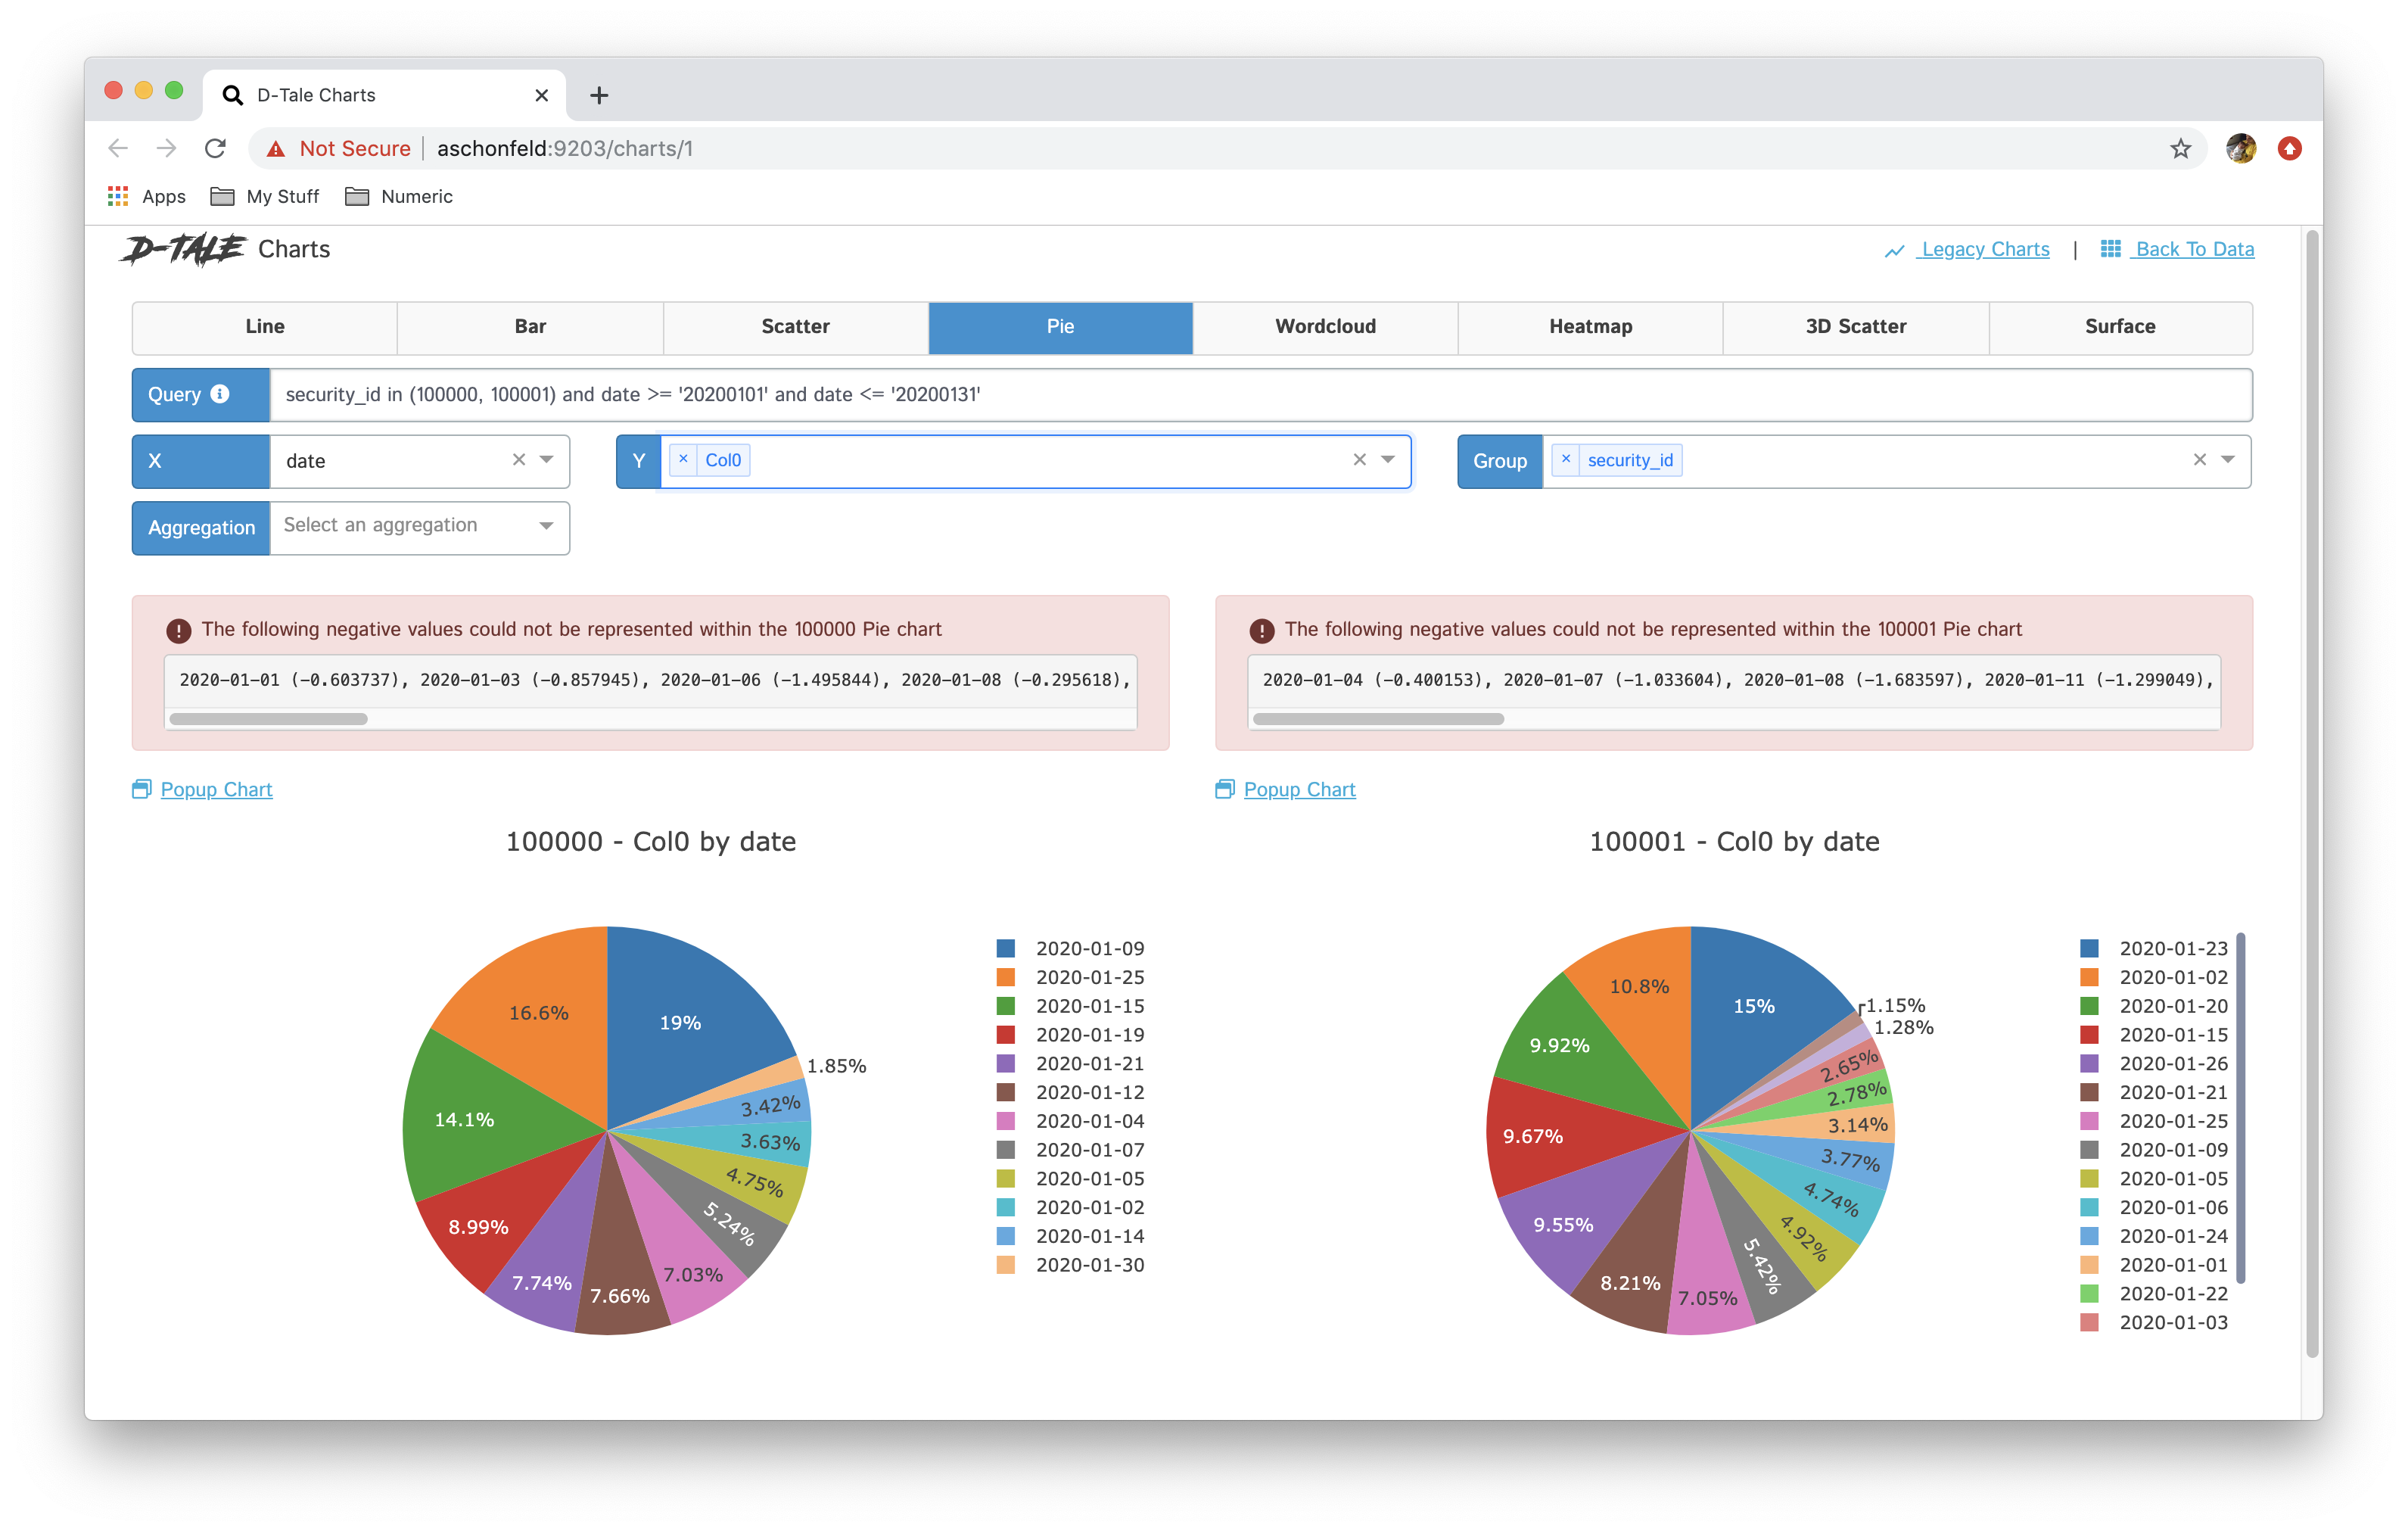 |
|
| wordcloud | 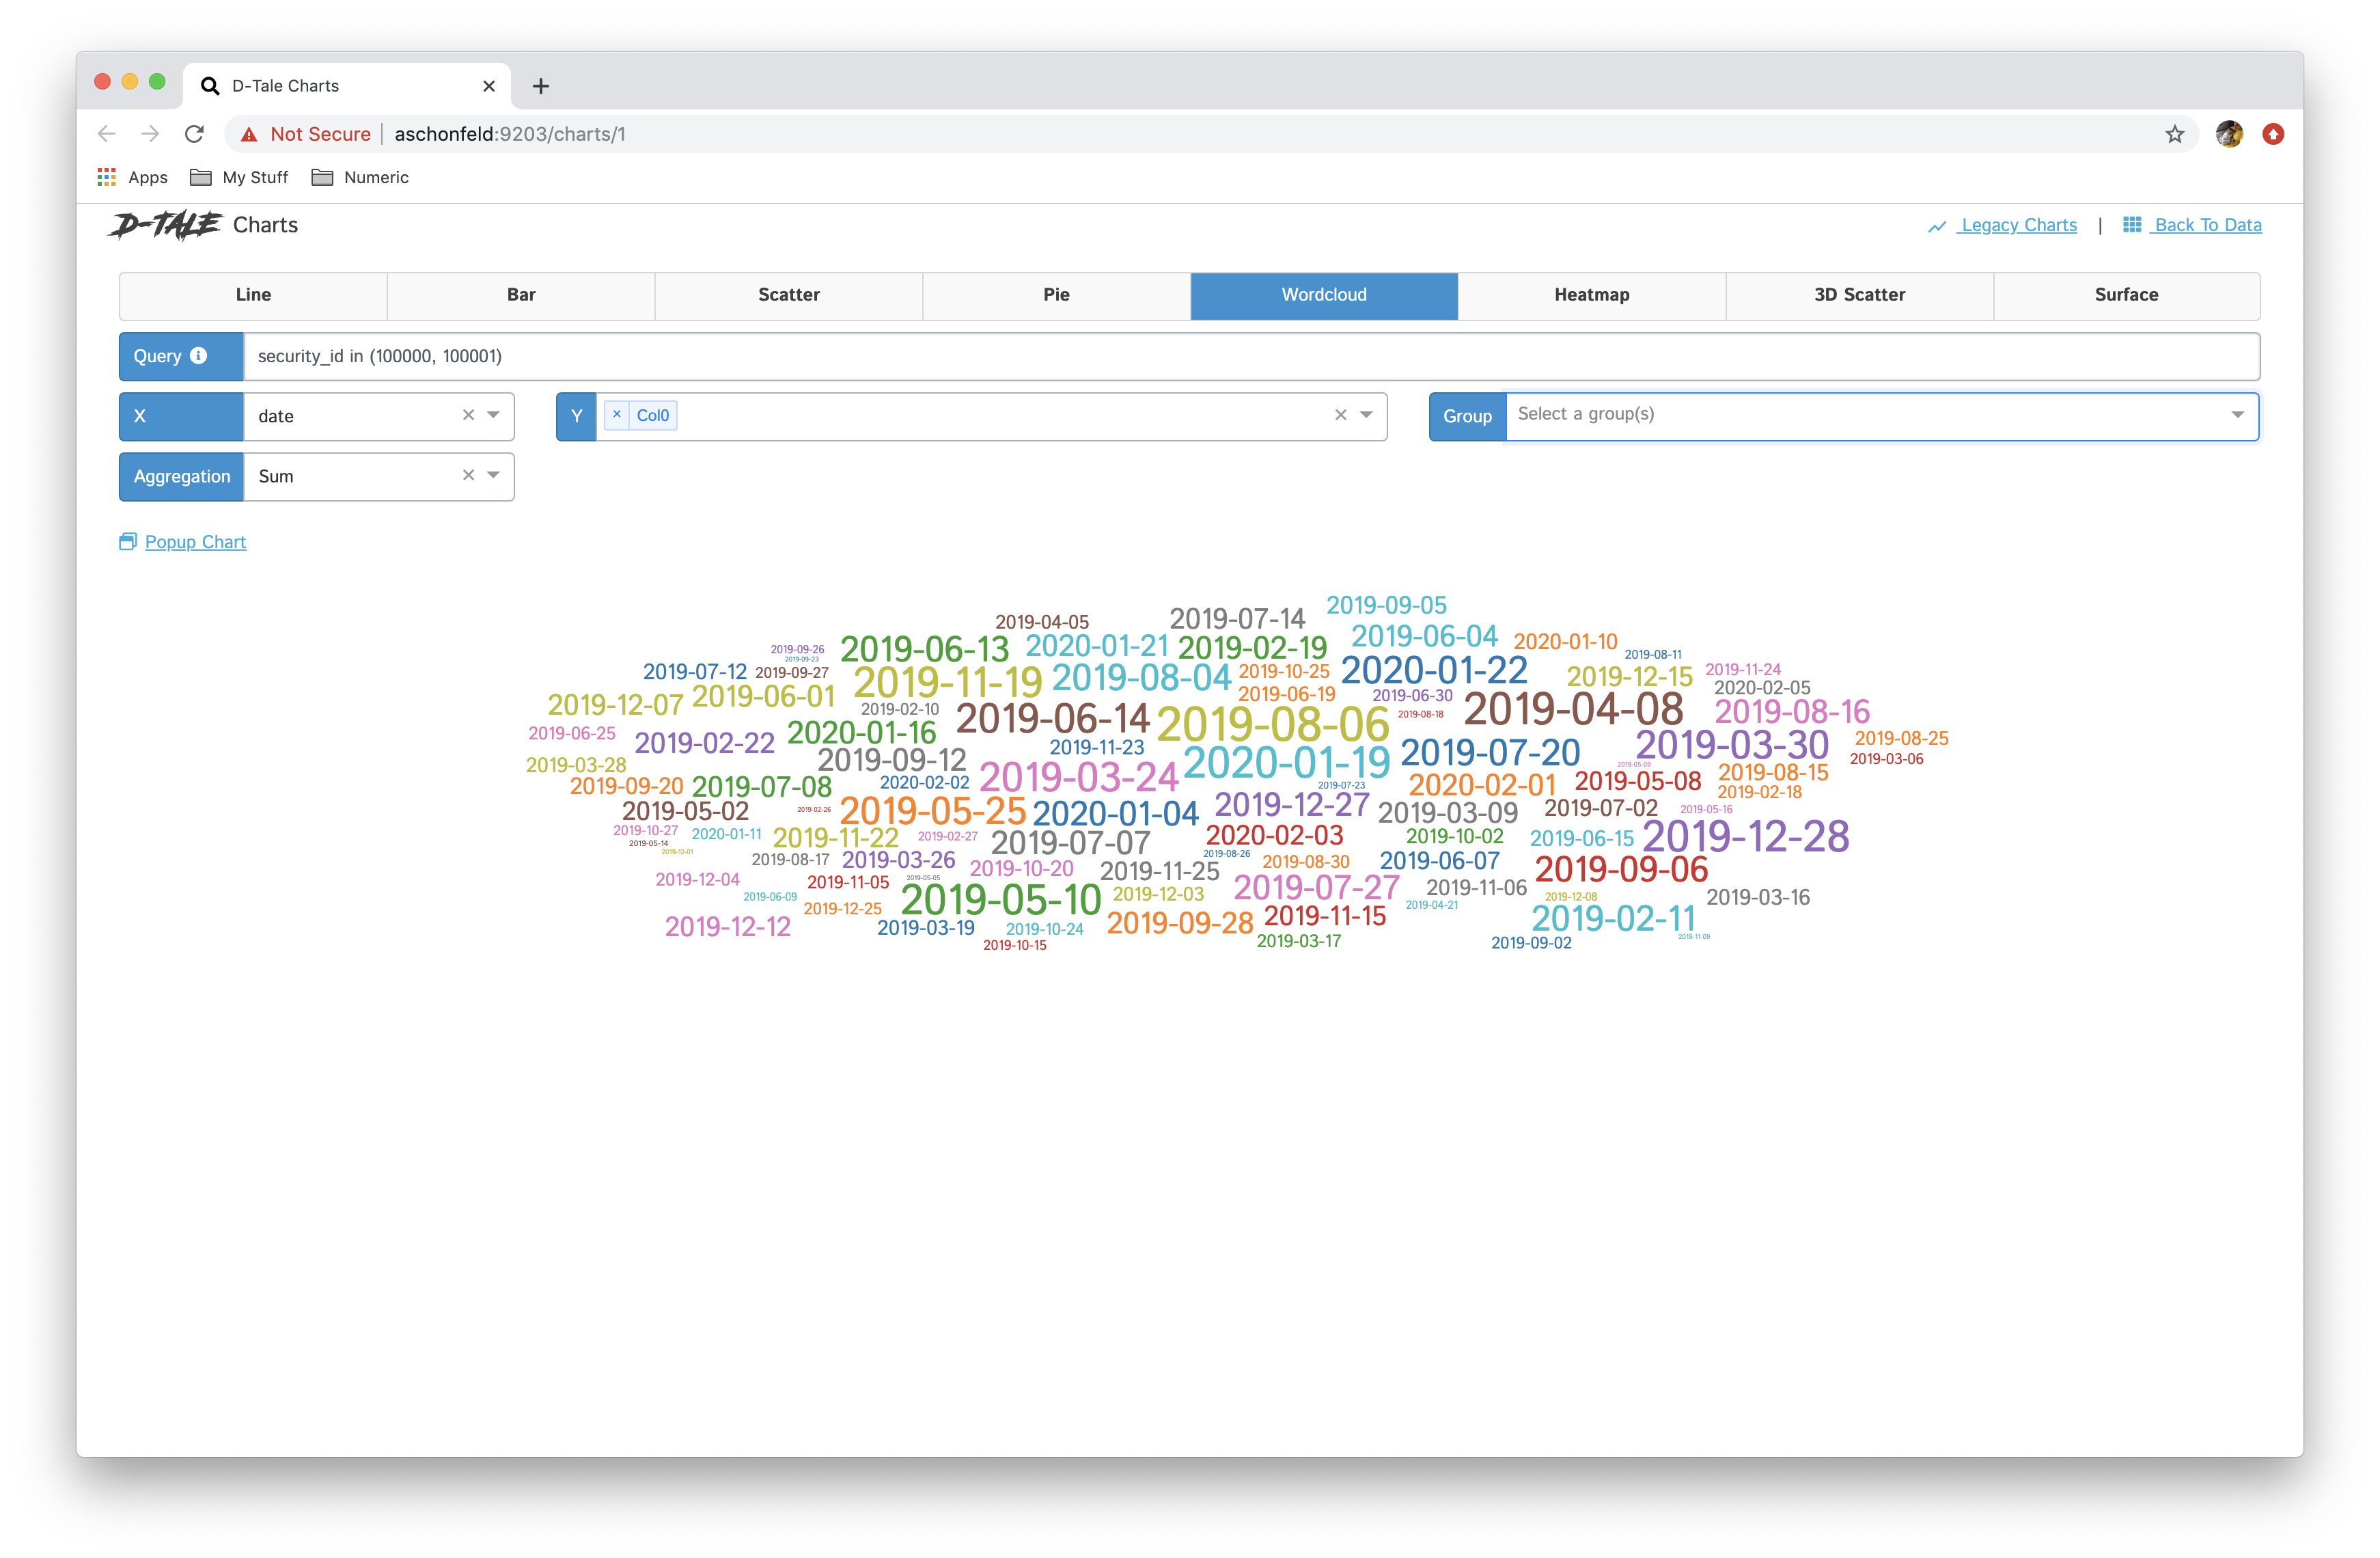 |
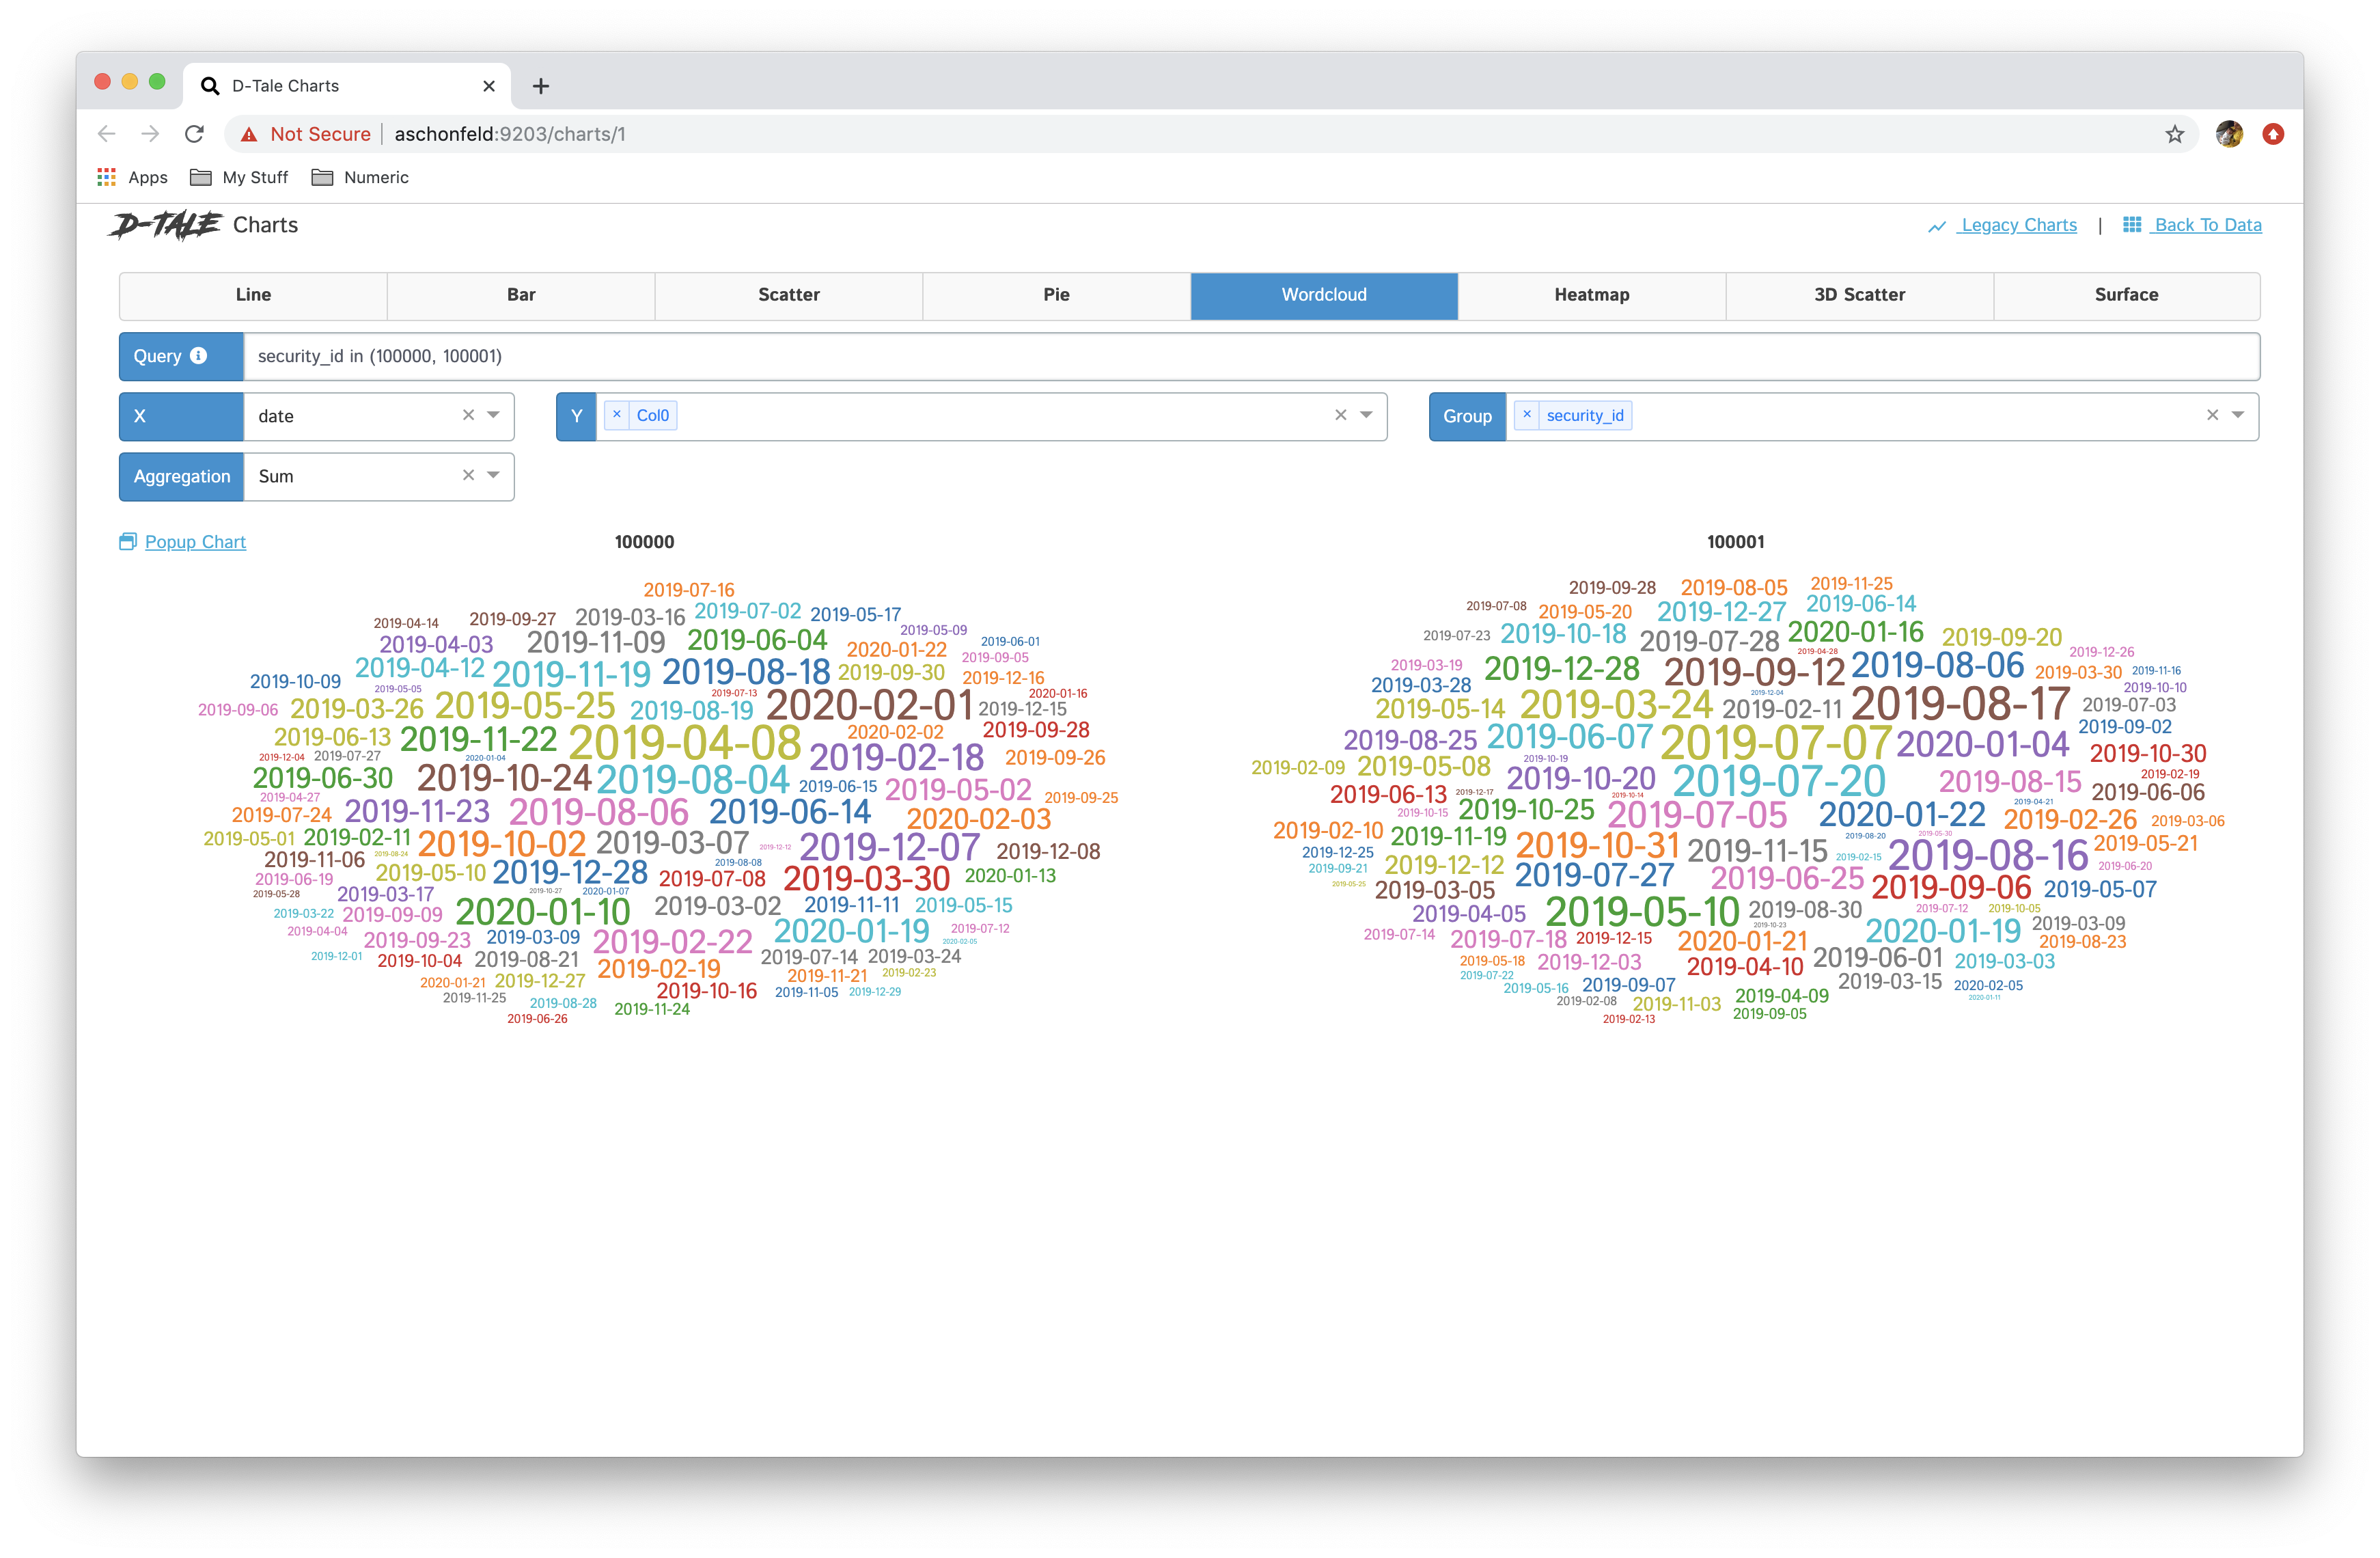 |
| heatmap | 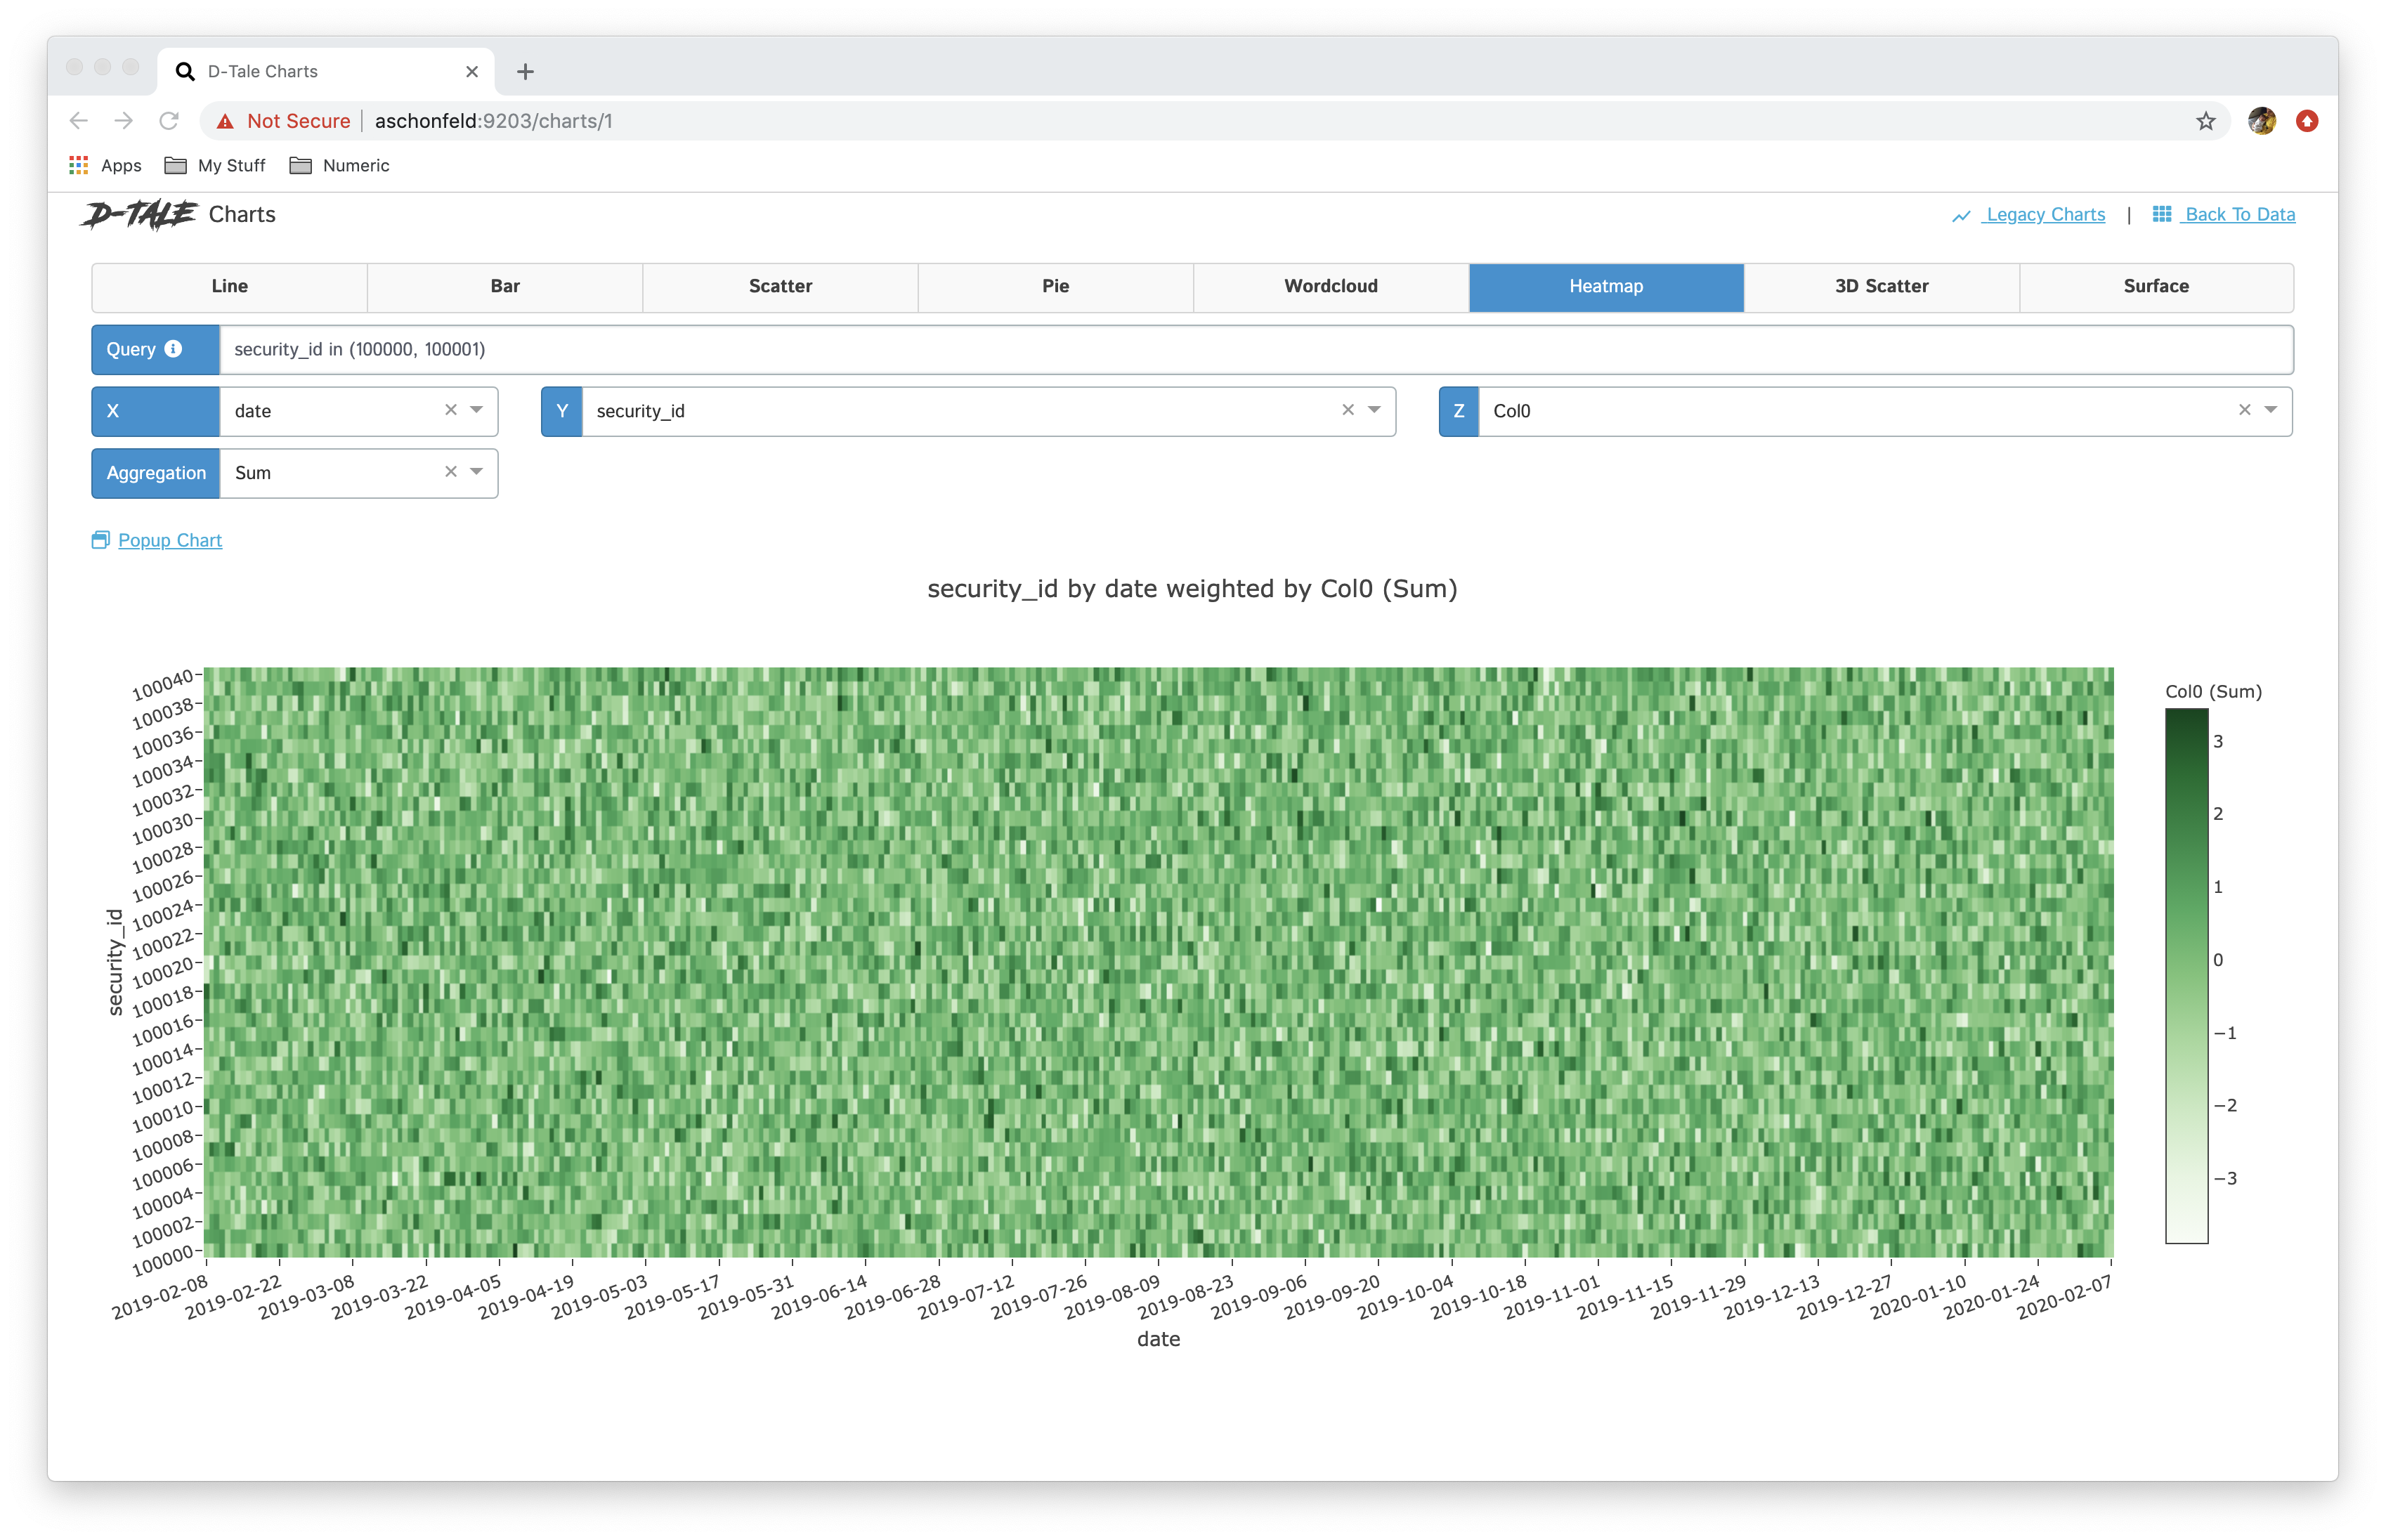 |
|
| 3D scatter |  |
|
| surface | 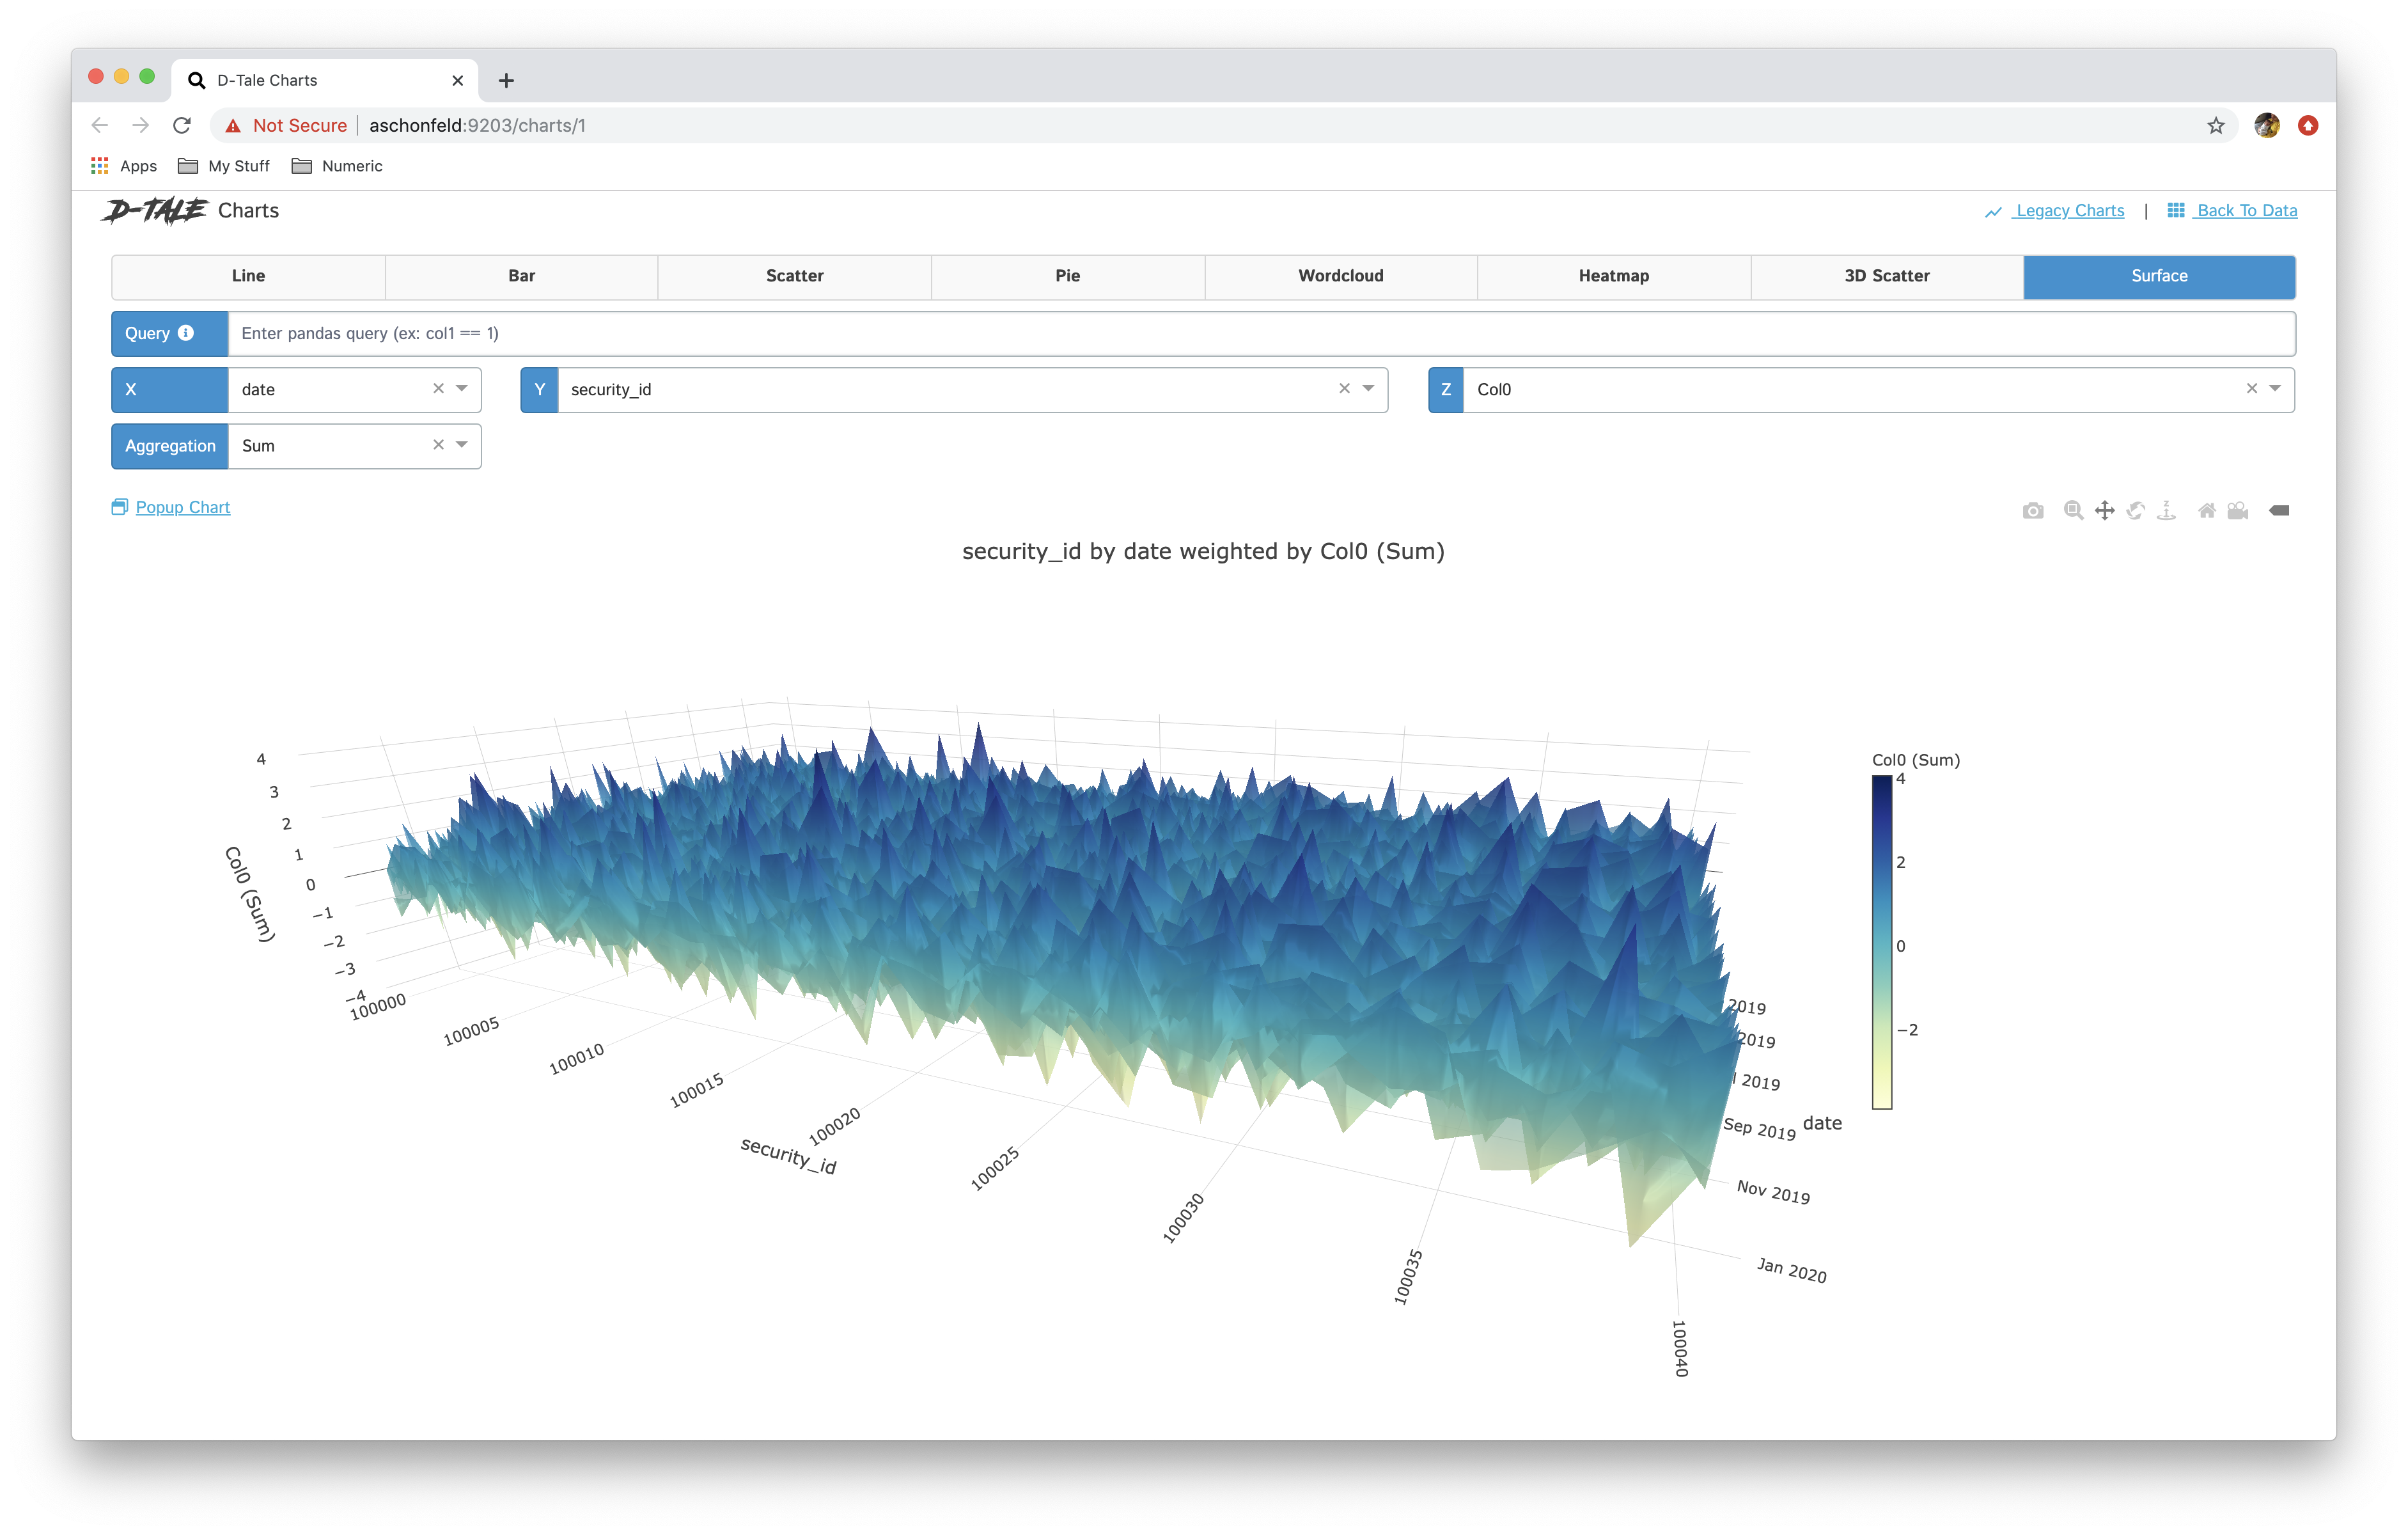 |
Selecting multiple columns for the Y-Axis will produce similar results to grouping in the sense that the chart will contain multiple series, but the difference is that for each column there will be a different Y-Axis associated with it in case the values contained within each column are on different scales.
| Multi Y-Axis | Editing Axis Ranges |
|---|---|
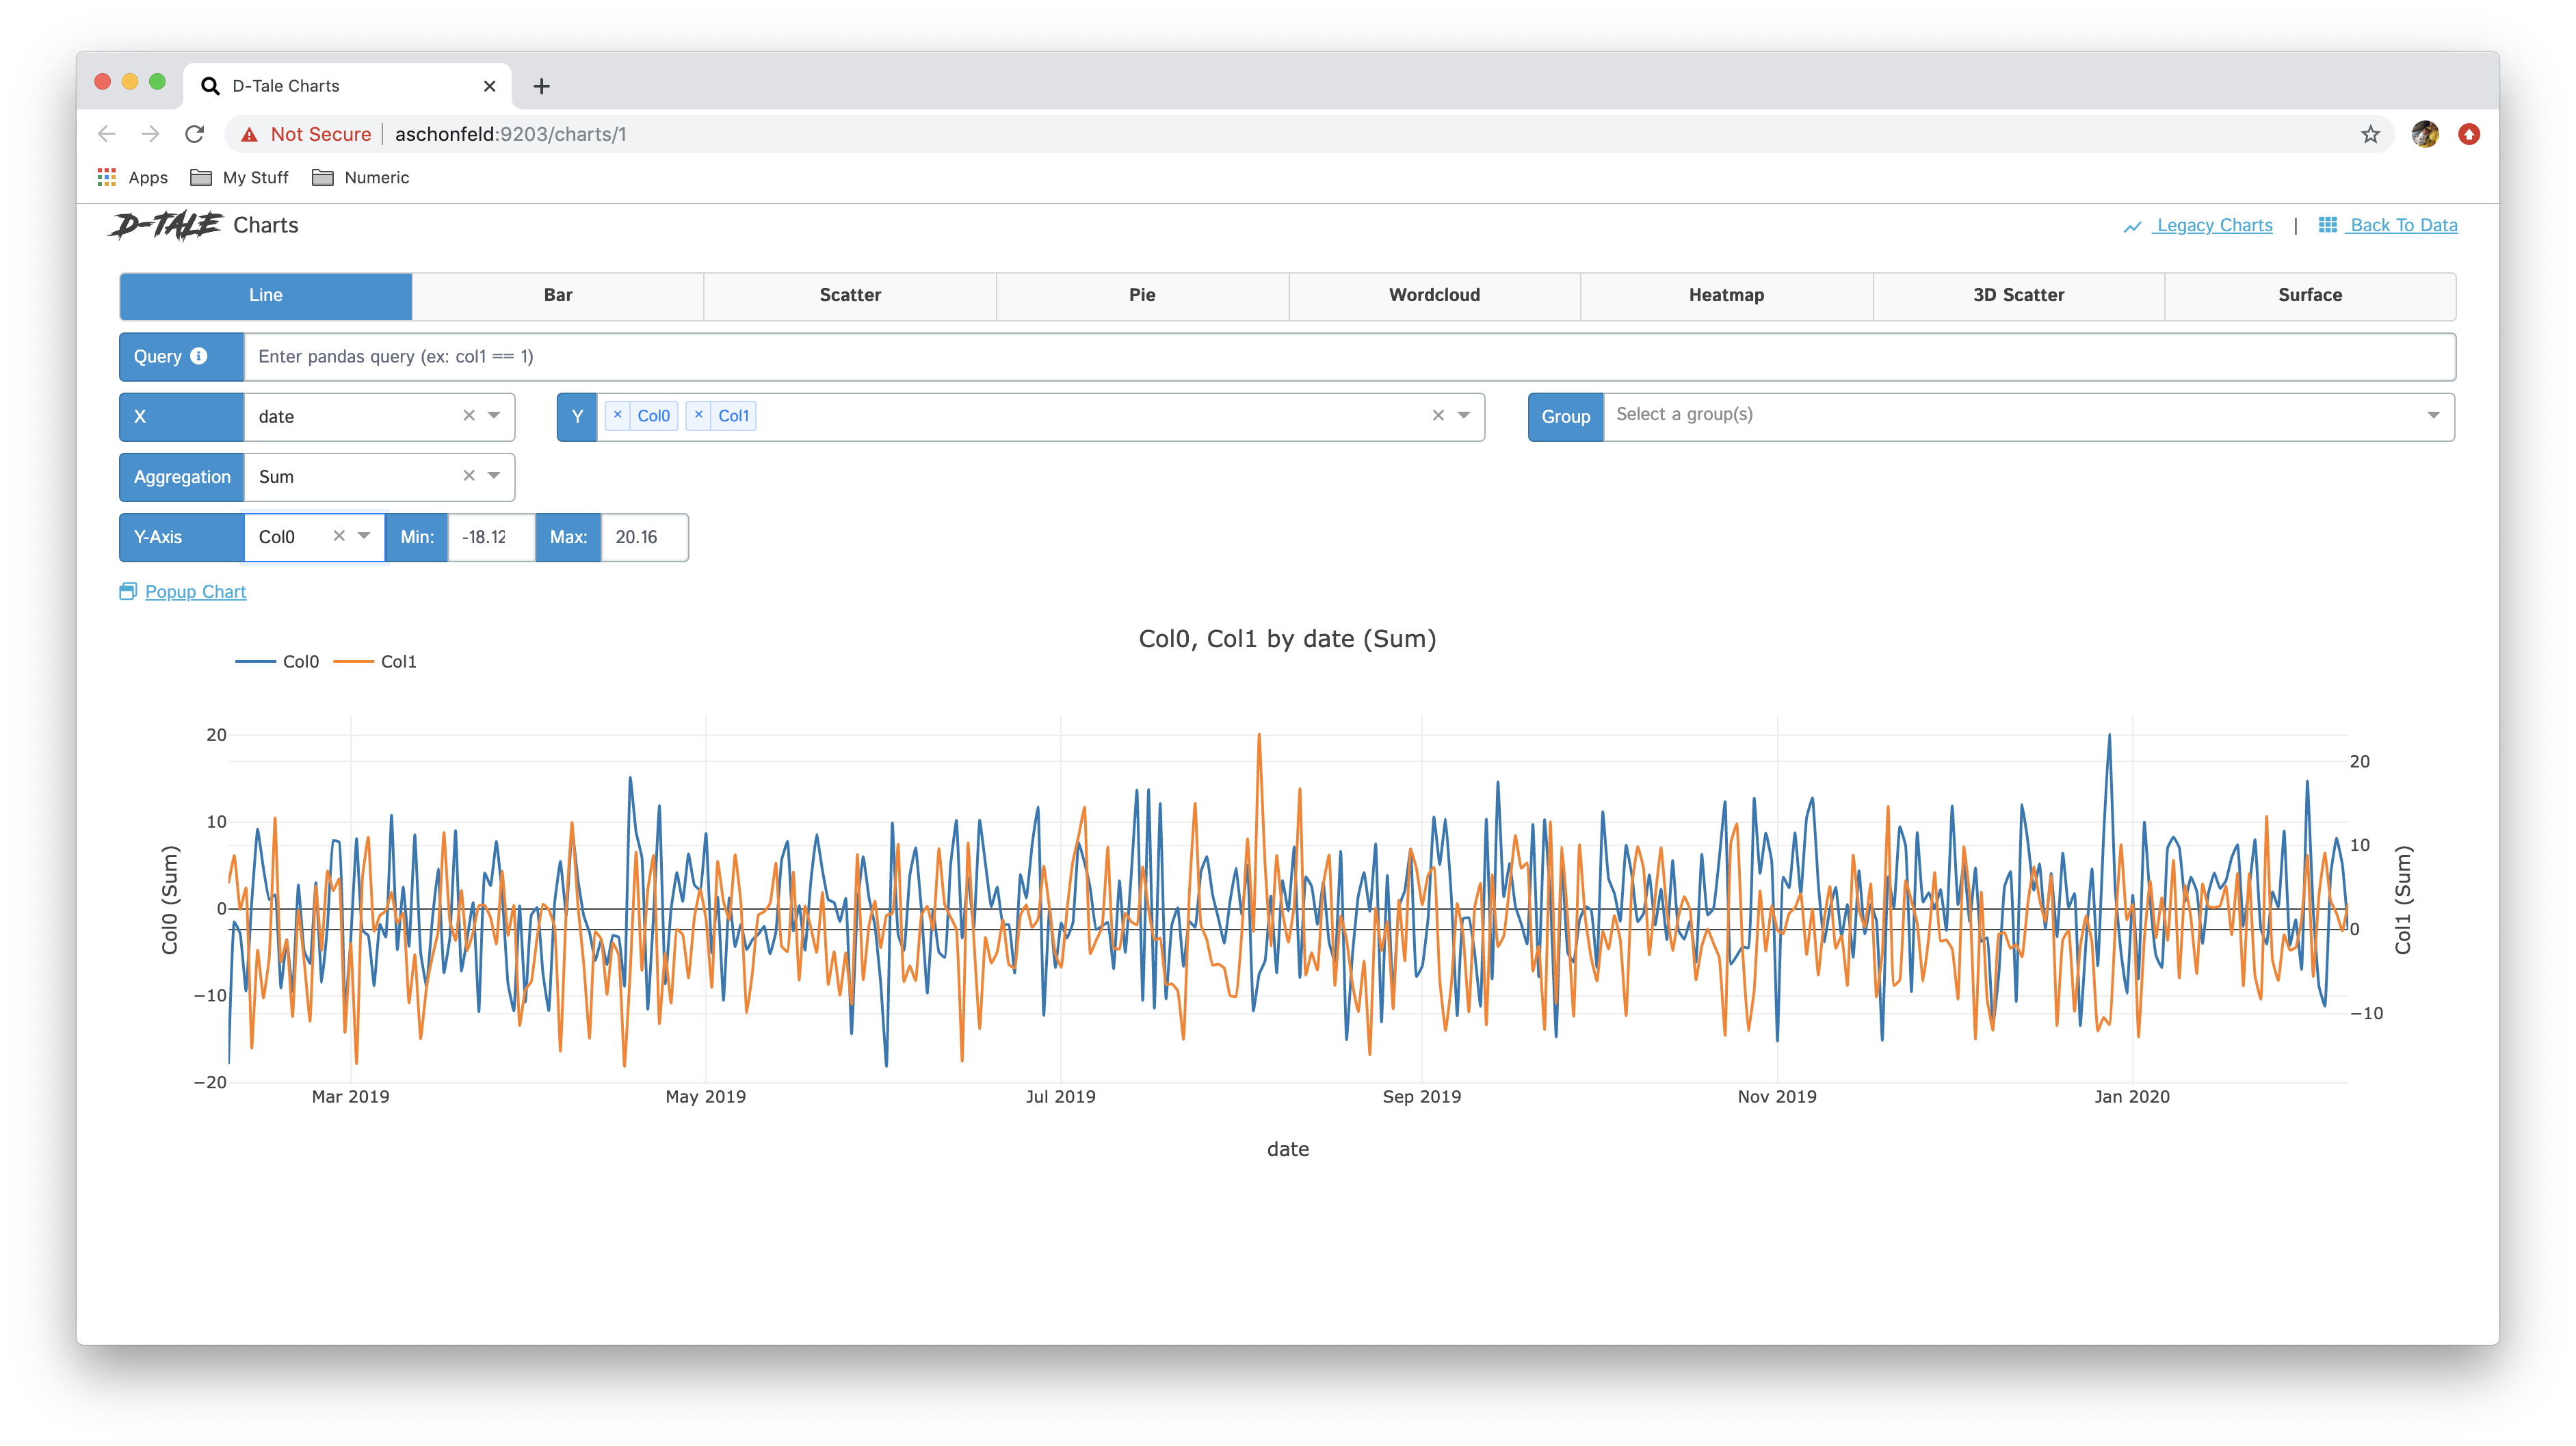 |
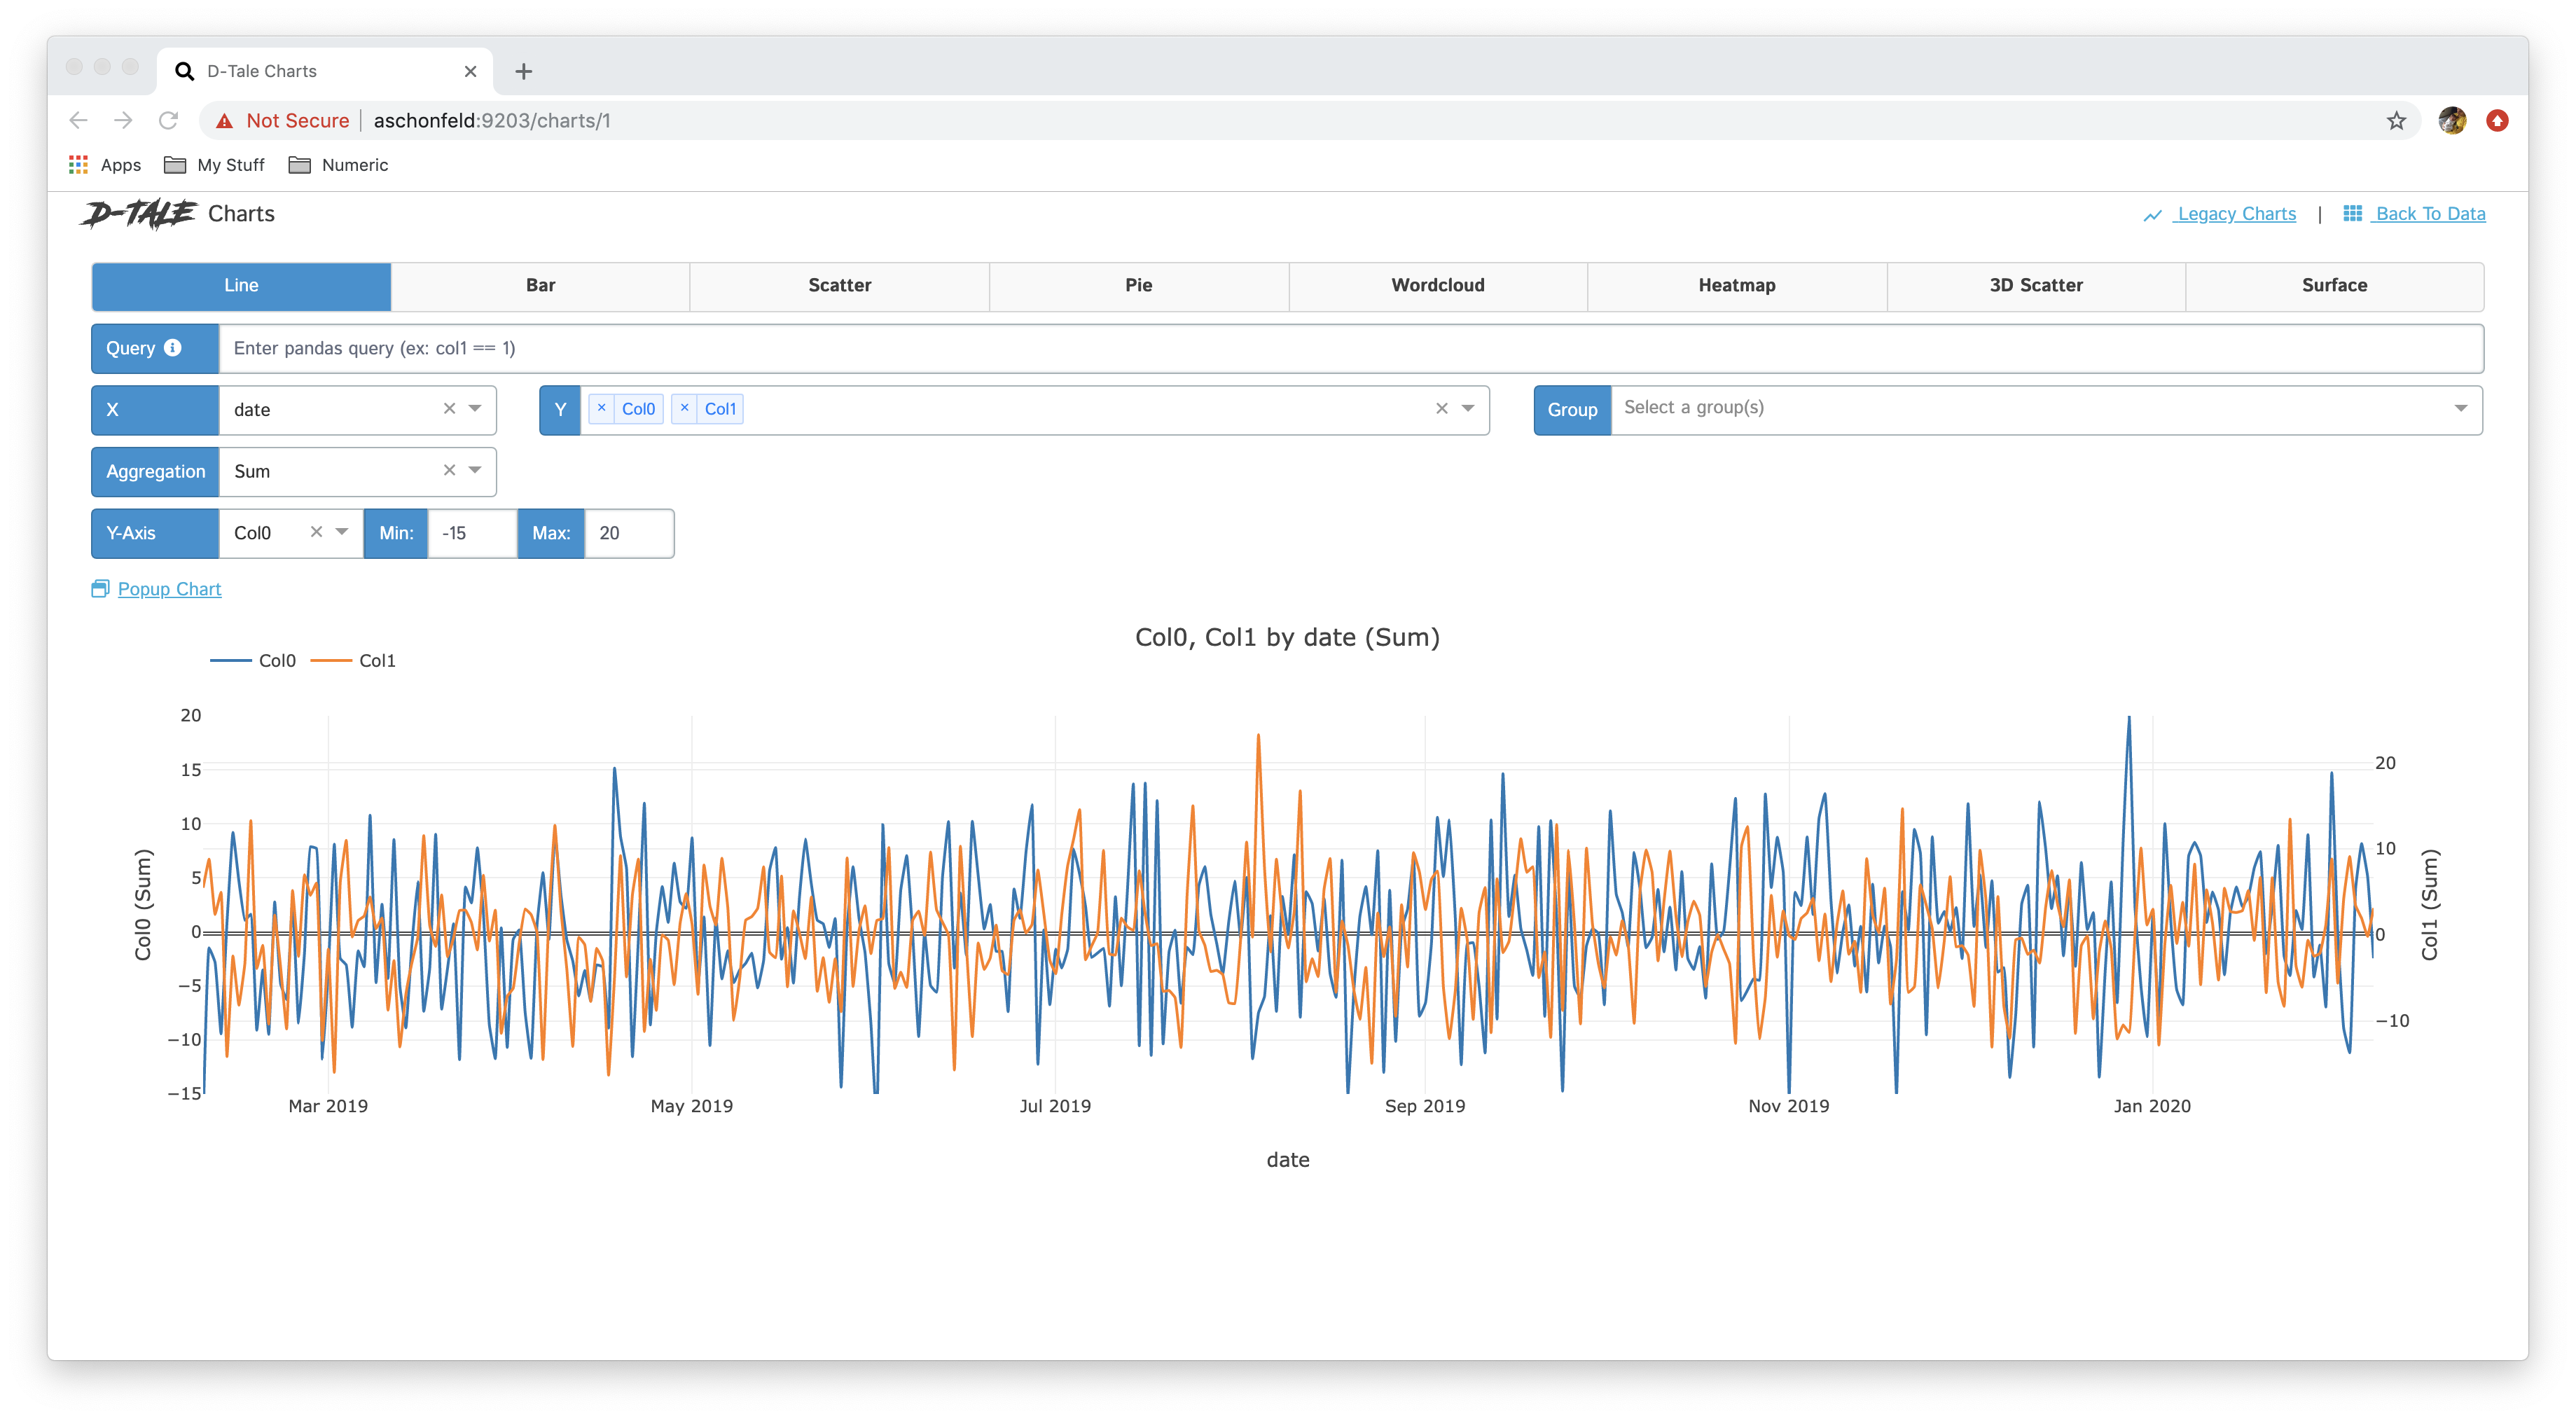 |
With a bar chart that only has a single Y-Axis you have the ability to sort the bars based on the values for the Y-Axis
| Pre-sort | Post-sort |
|---|---|
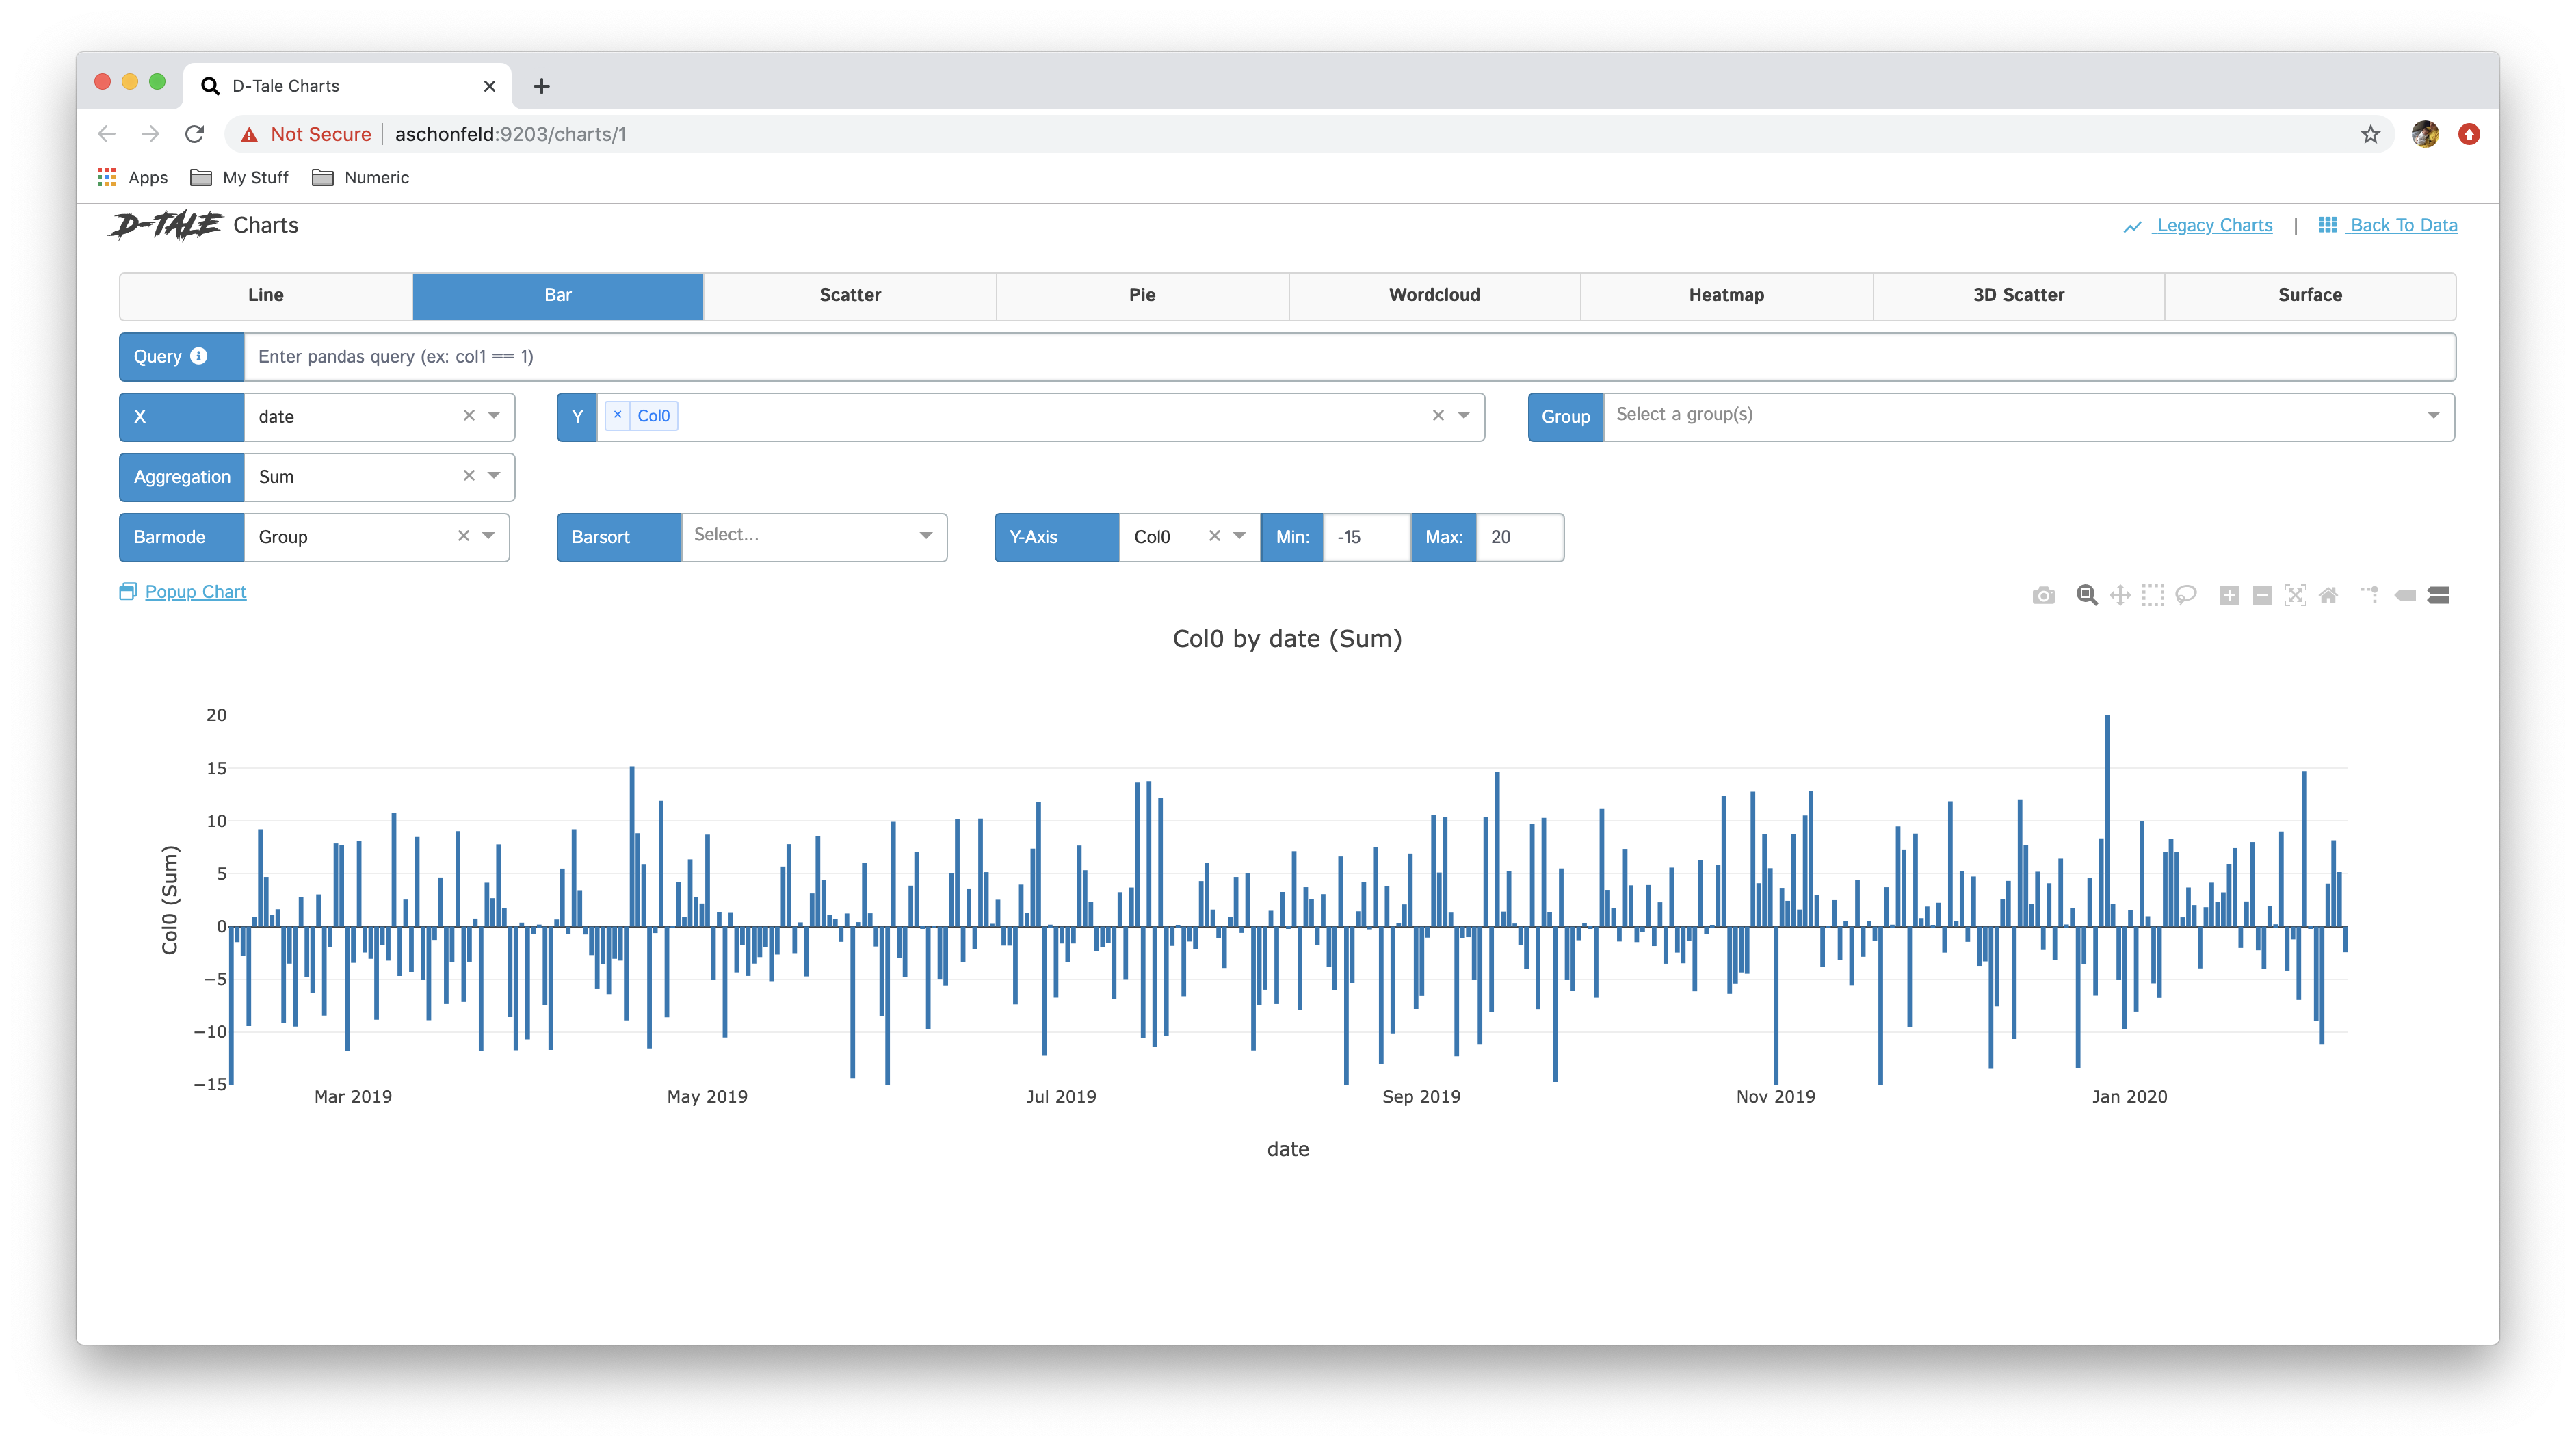 |
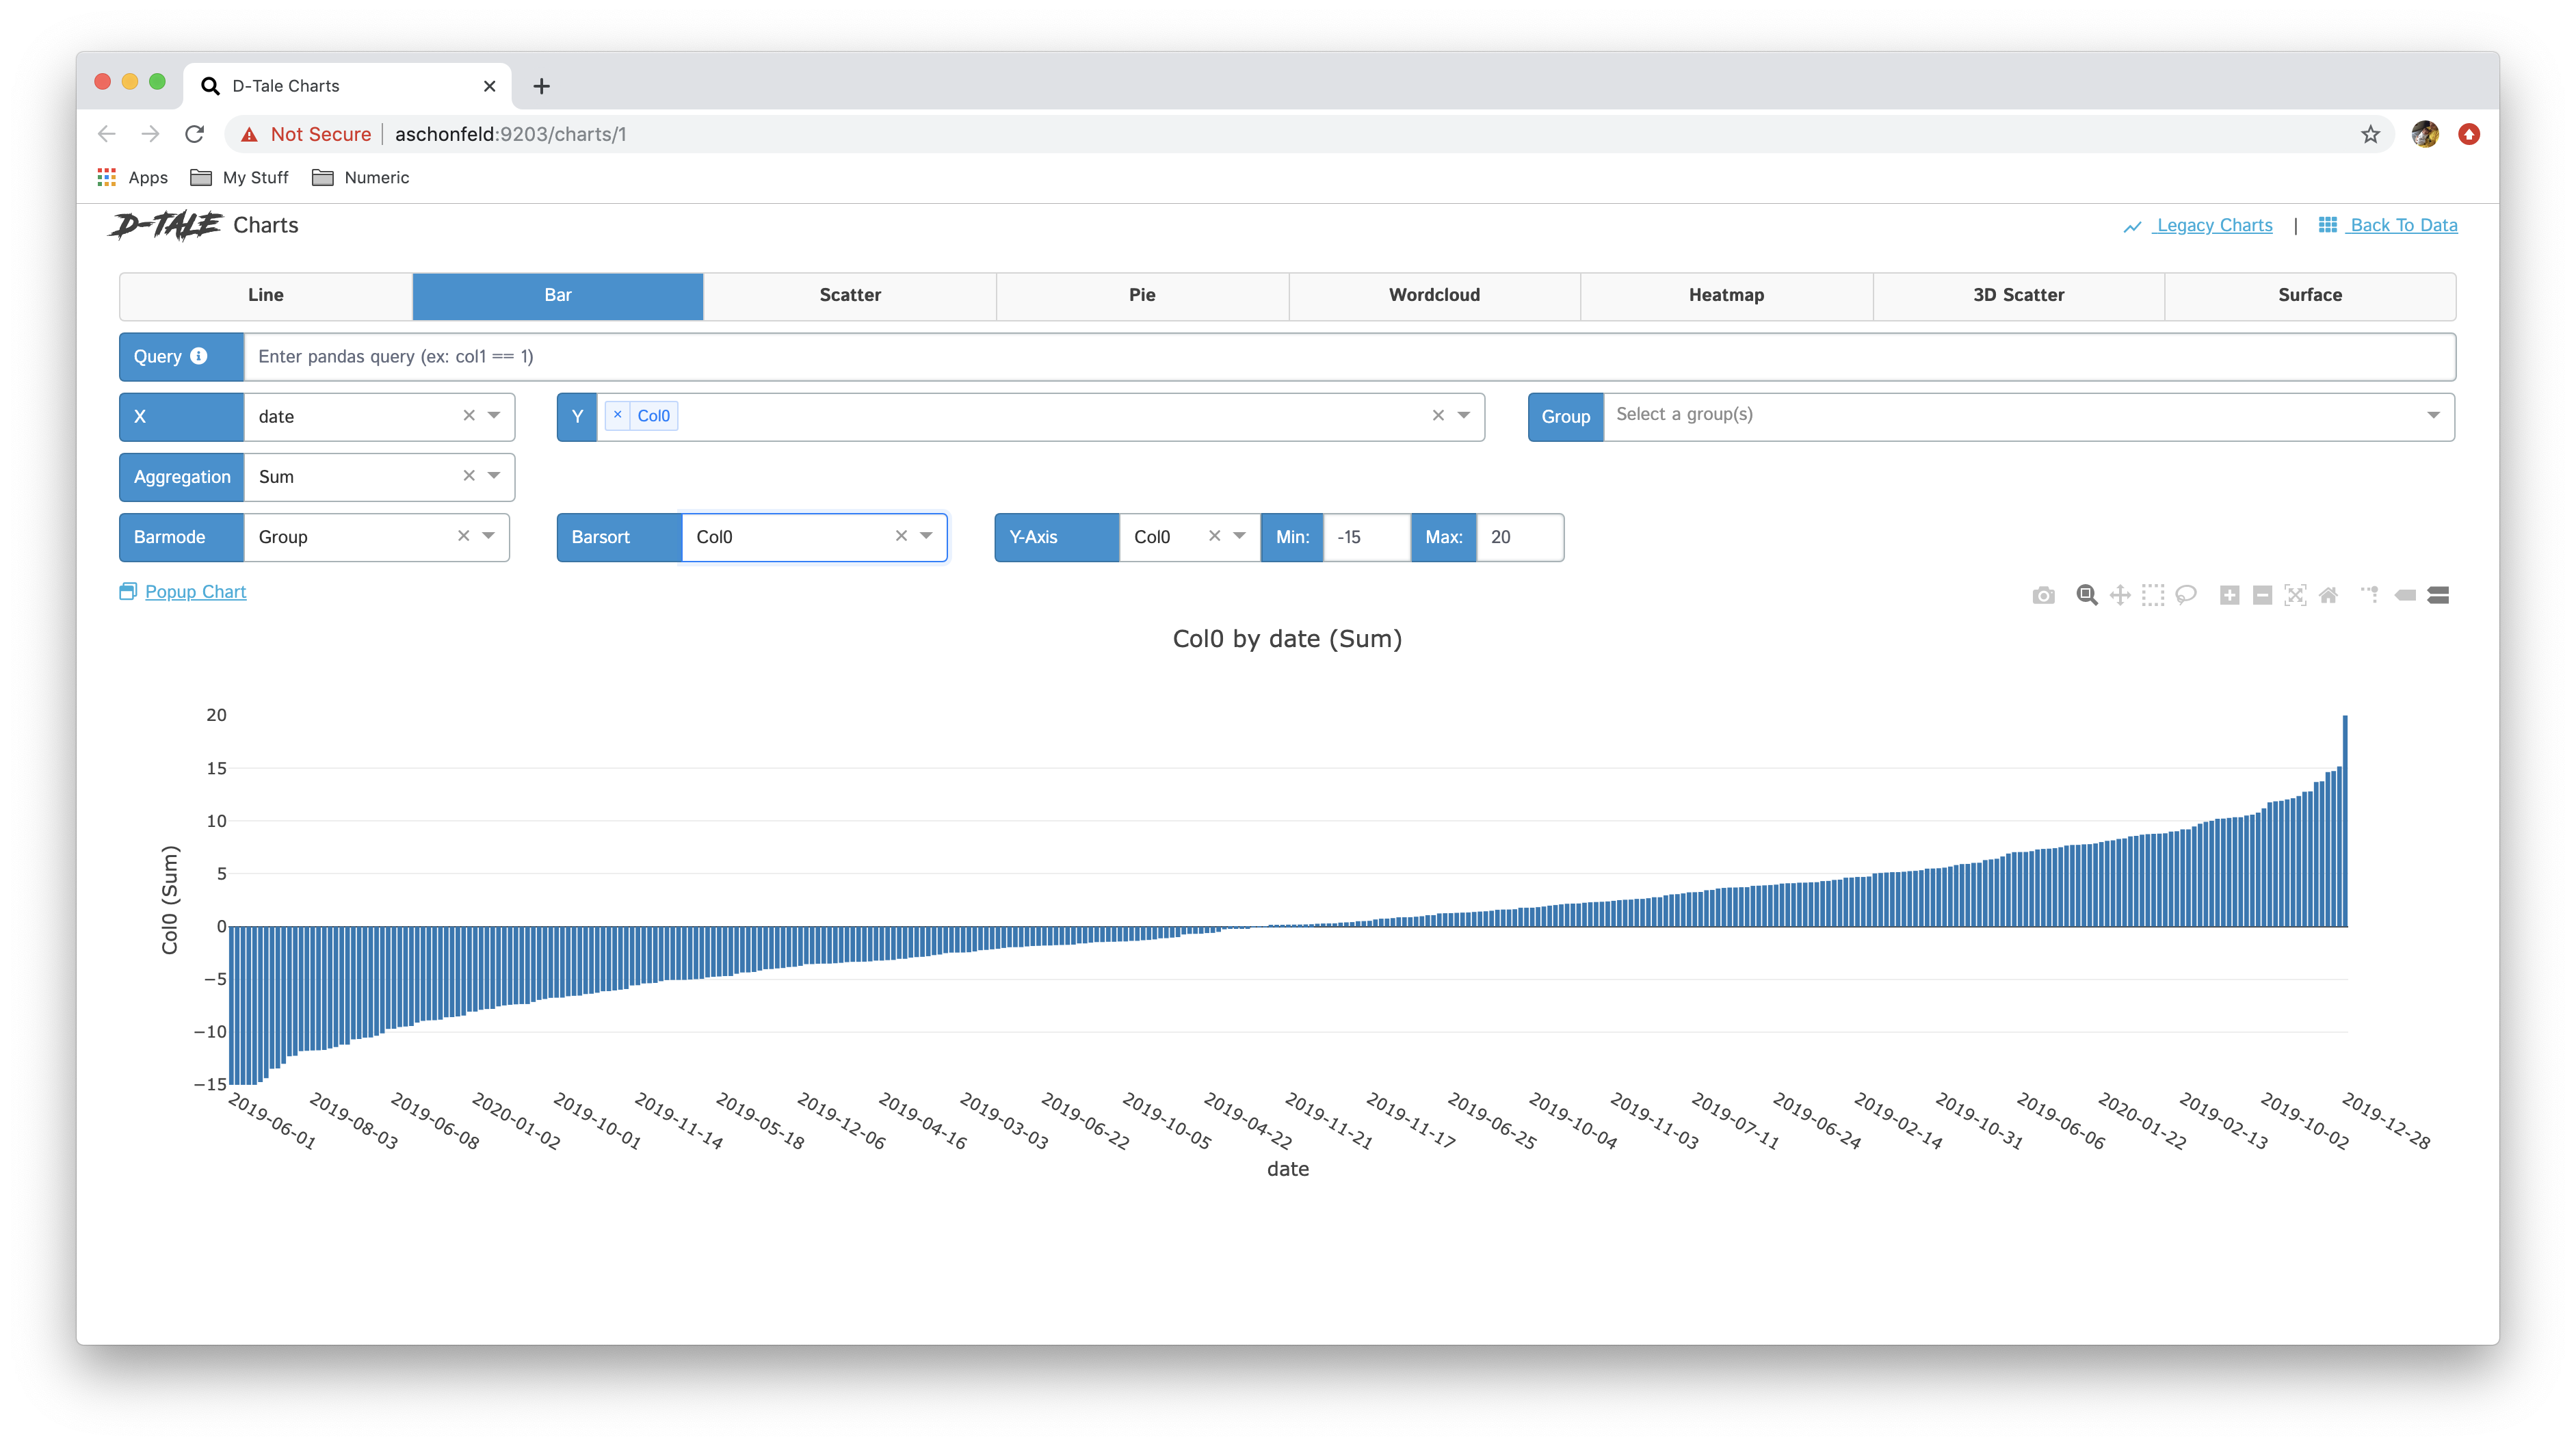 |
This is a very powerful feature with many more features that could be offered (linked subplots, different statistical aggregations, etc...) so please submit issues :)
If you miss the legacy (non-plotly/dash) charts, not to worry! They are still available from the link in the upper-right corner, but on for a limited time... Here is the documentation for those: Legacy Charts
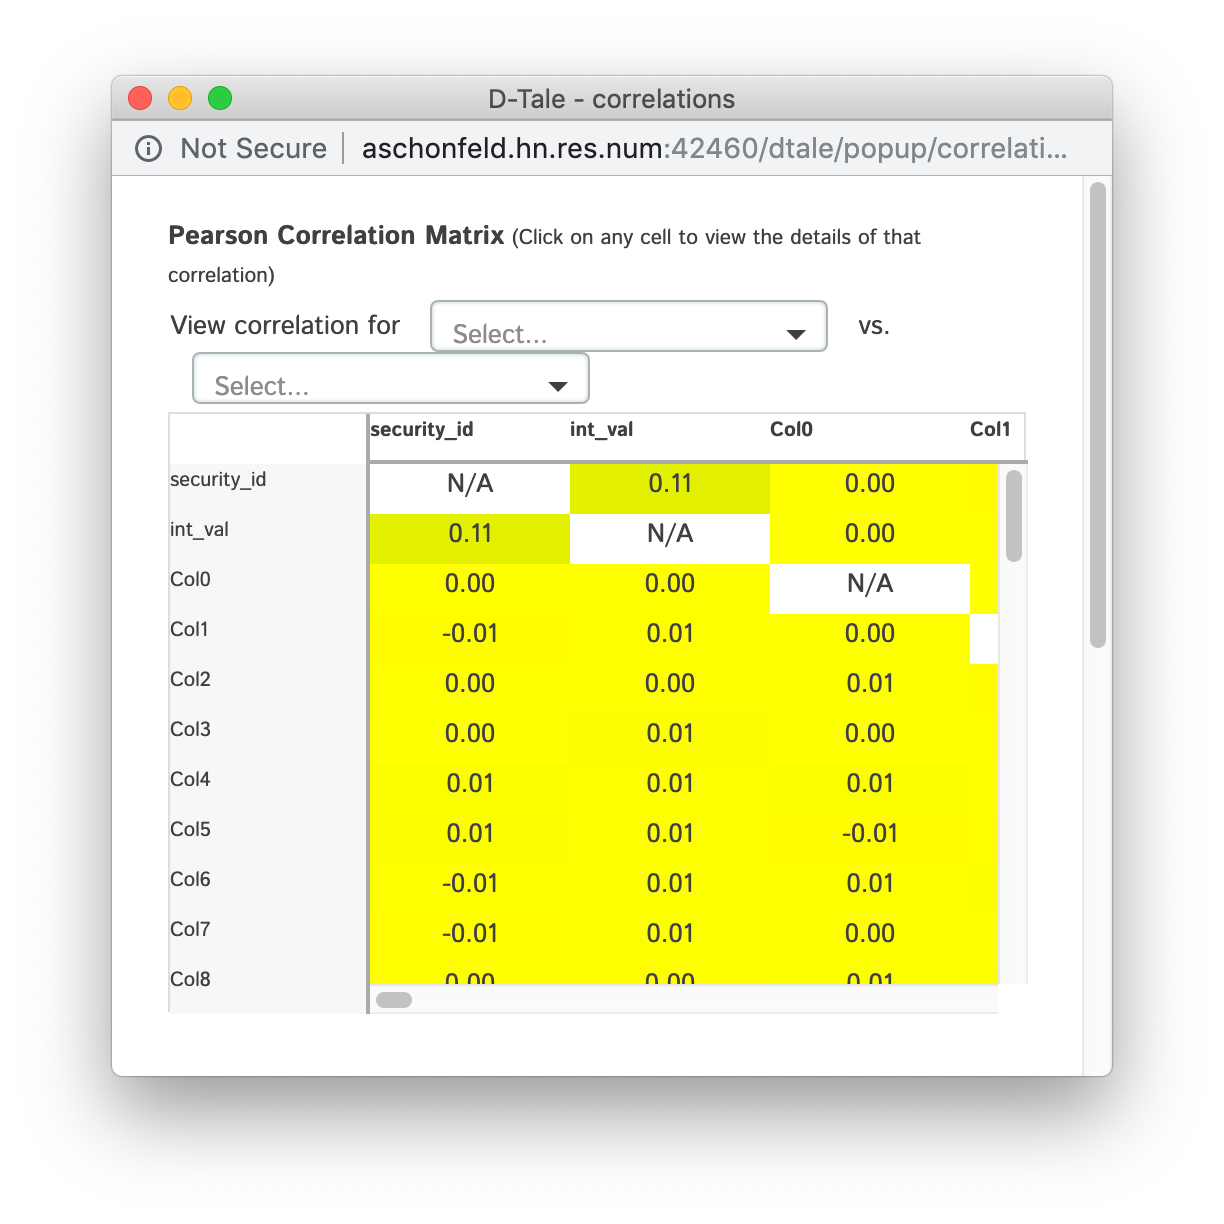
Shows a pearson correlation matrix of all numeric columns against all other numeric columns
| Matrix | Timeseries | Scatter |
|---|---|---|
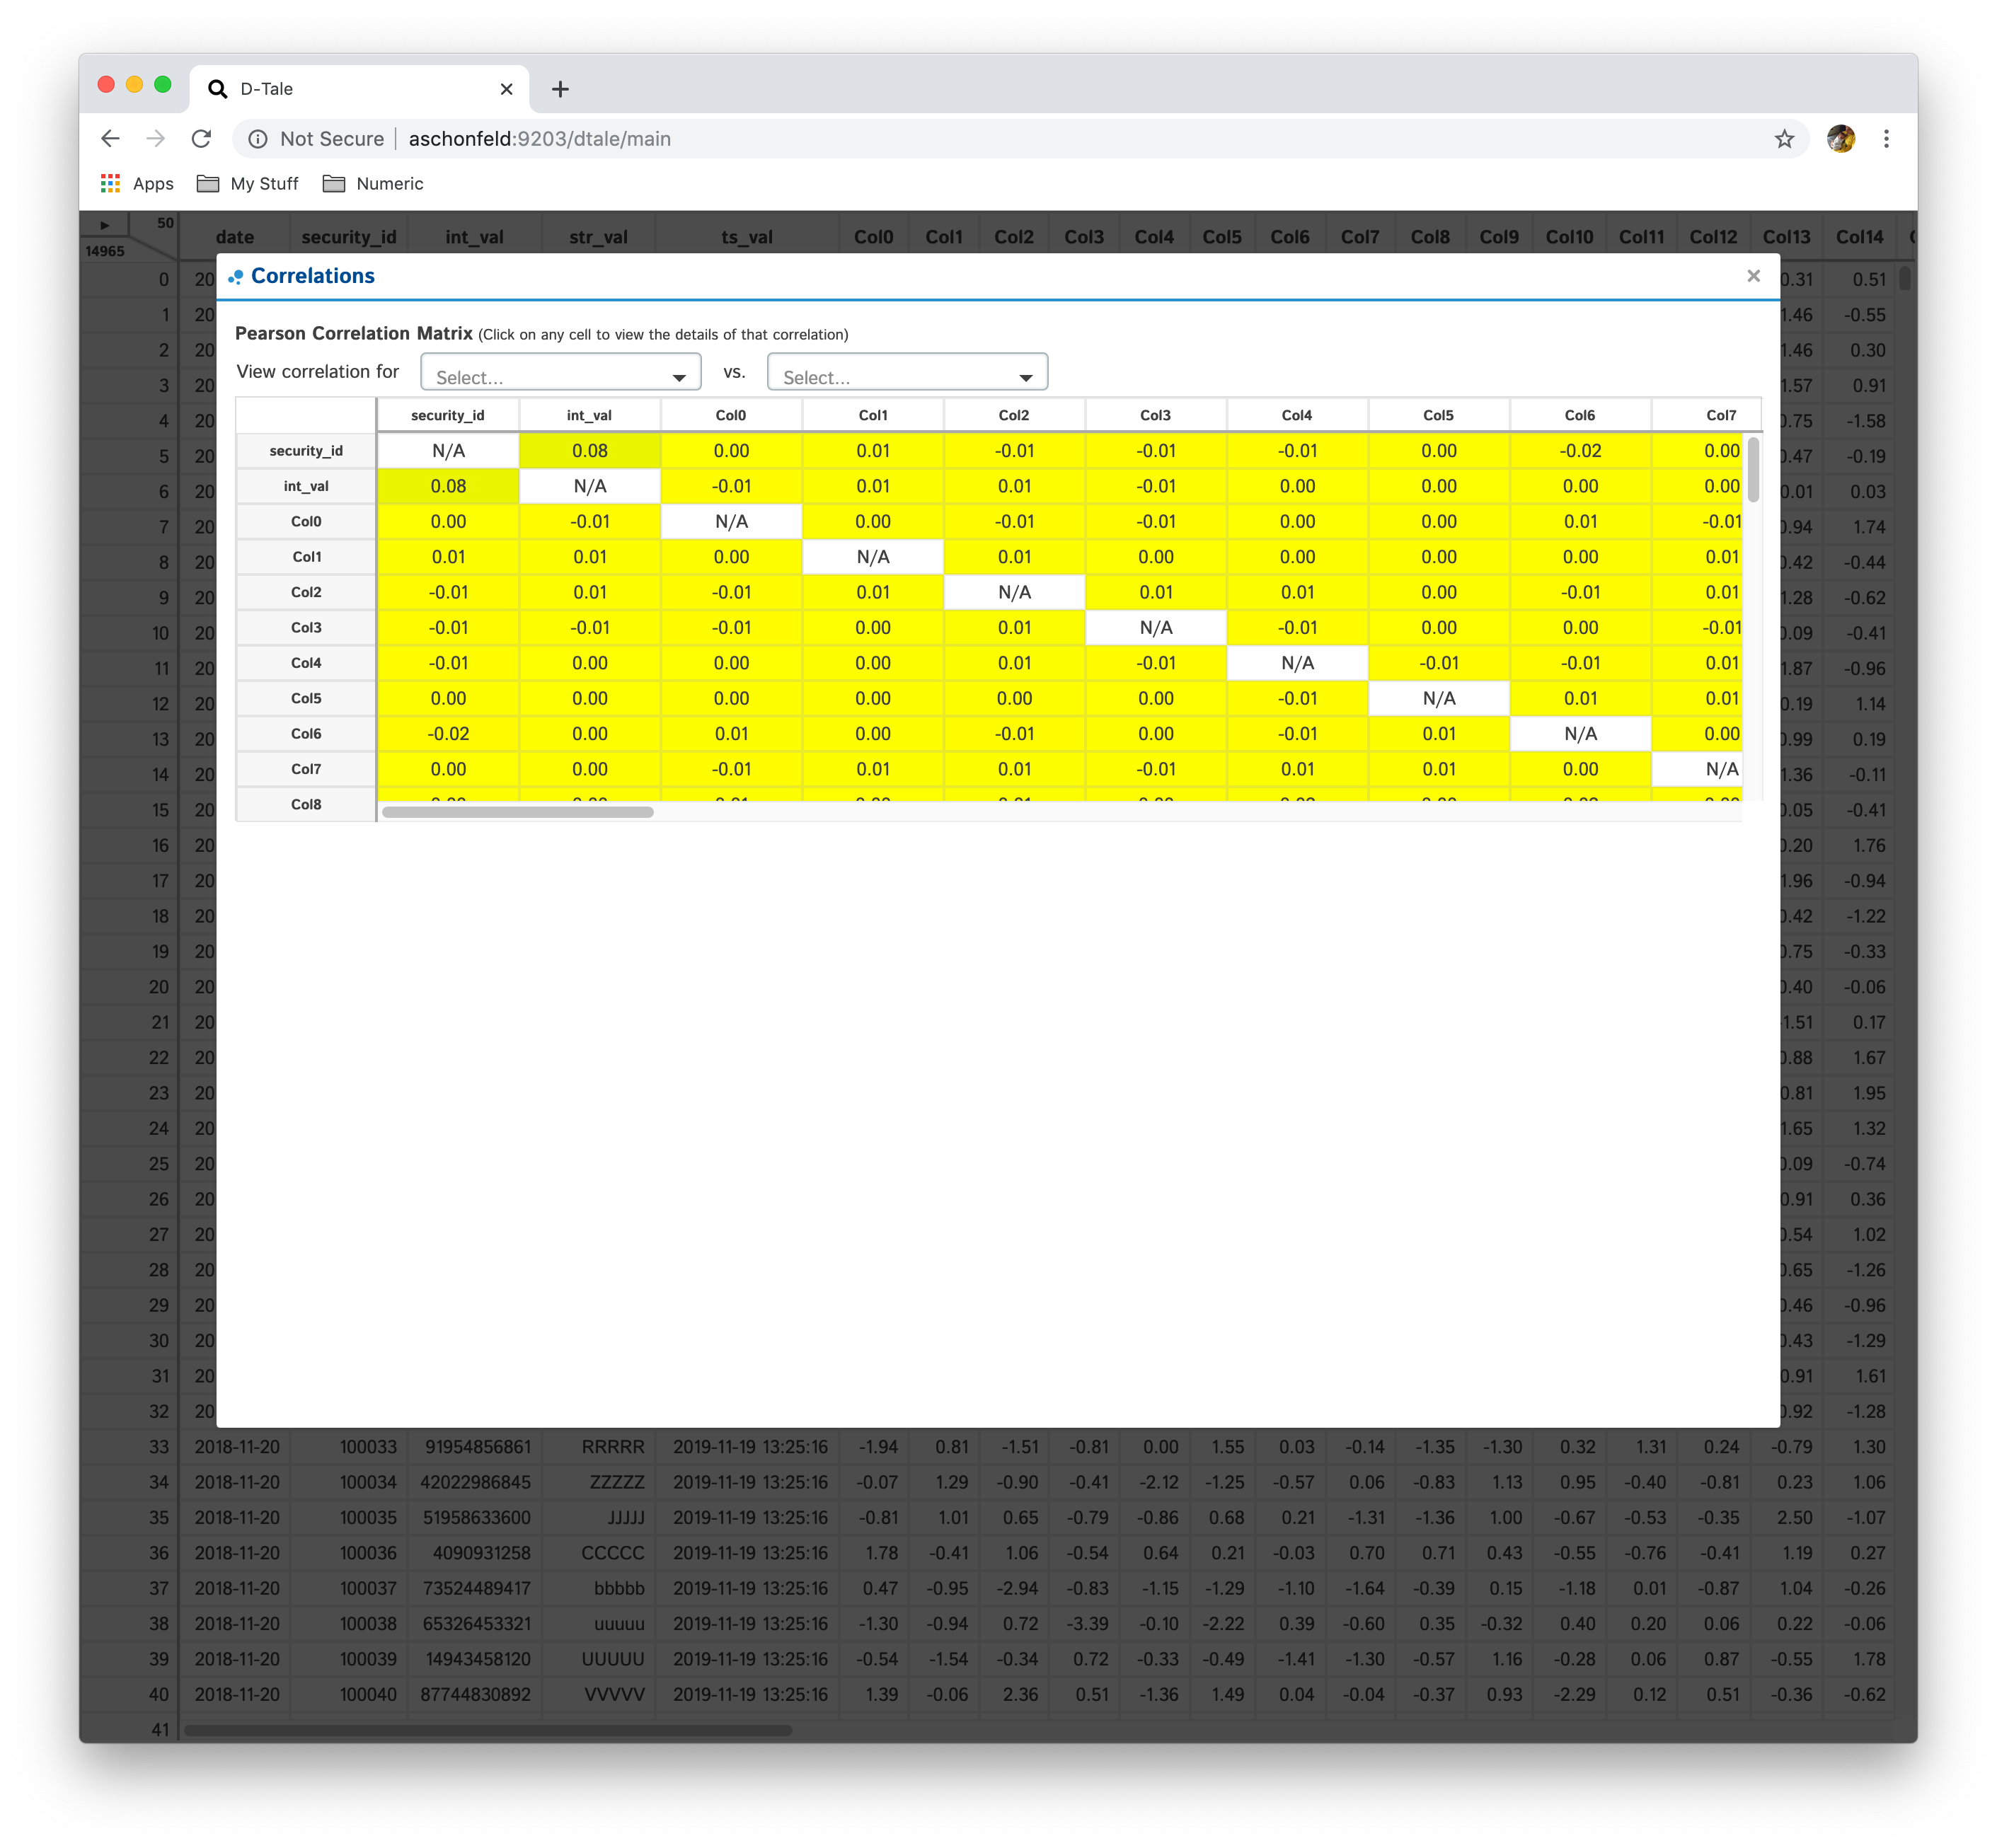 |
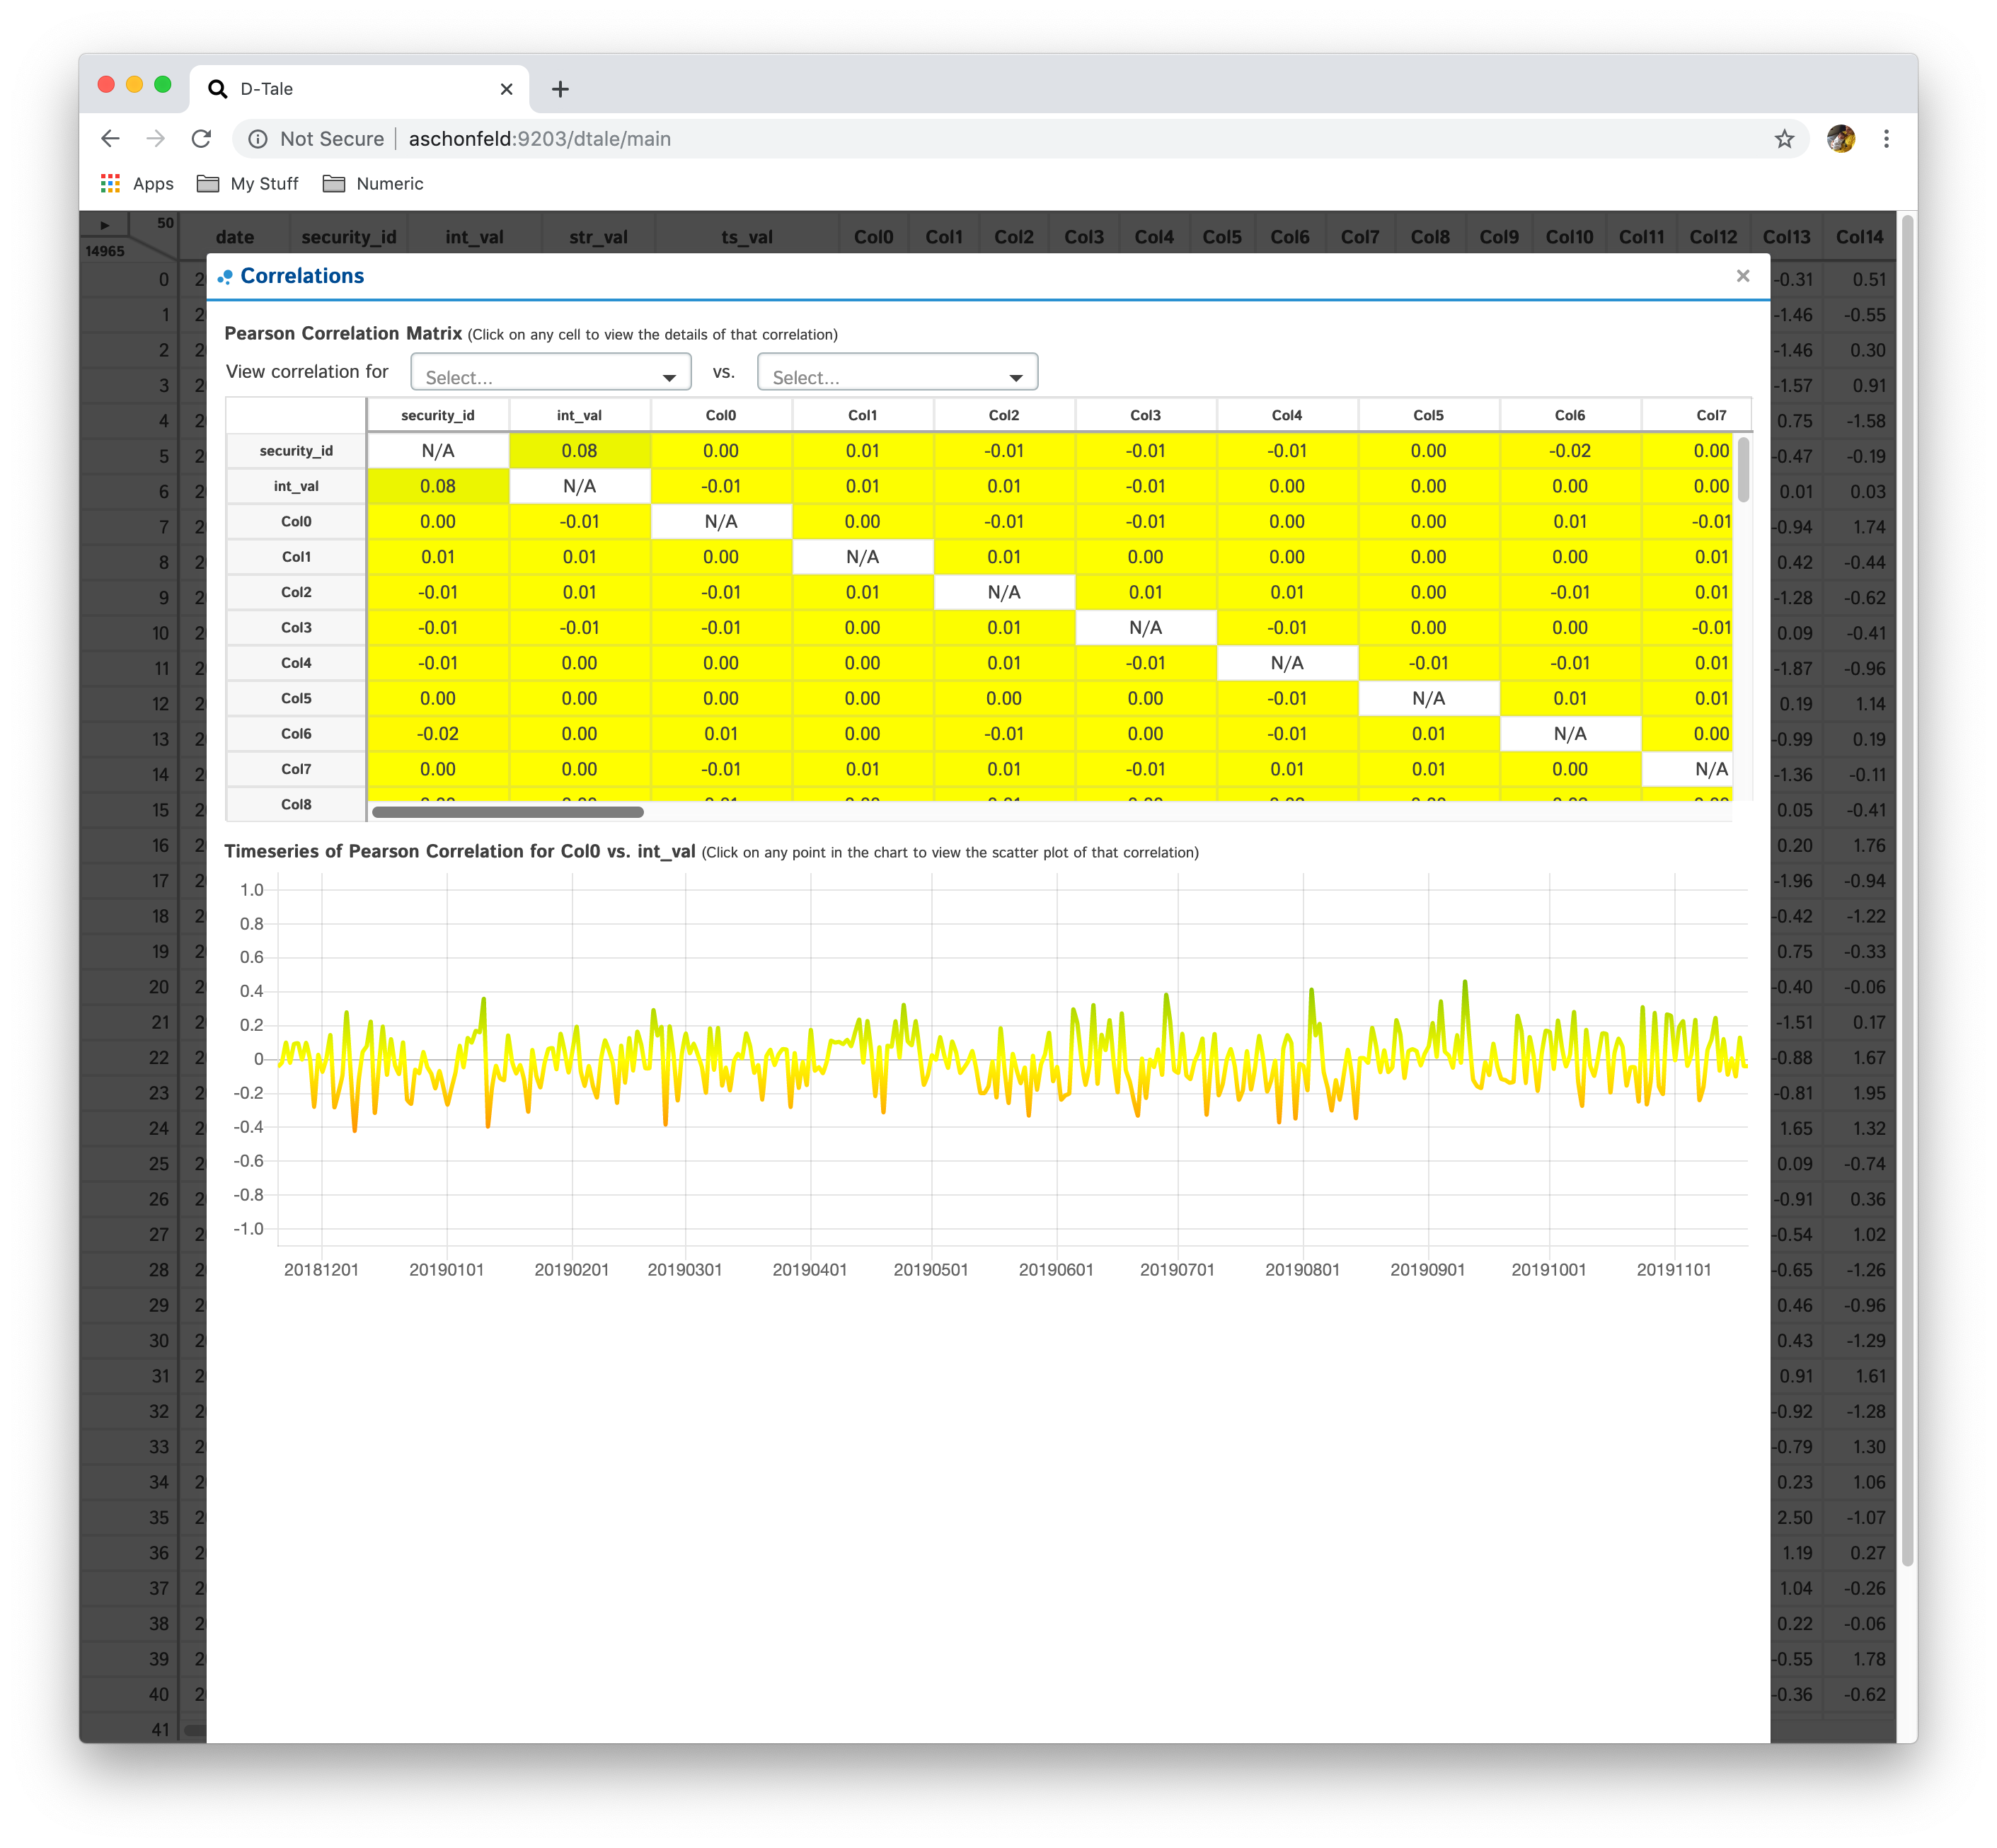 |
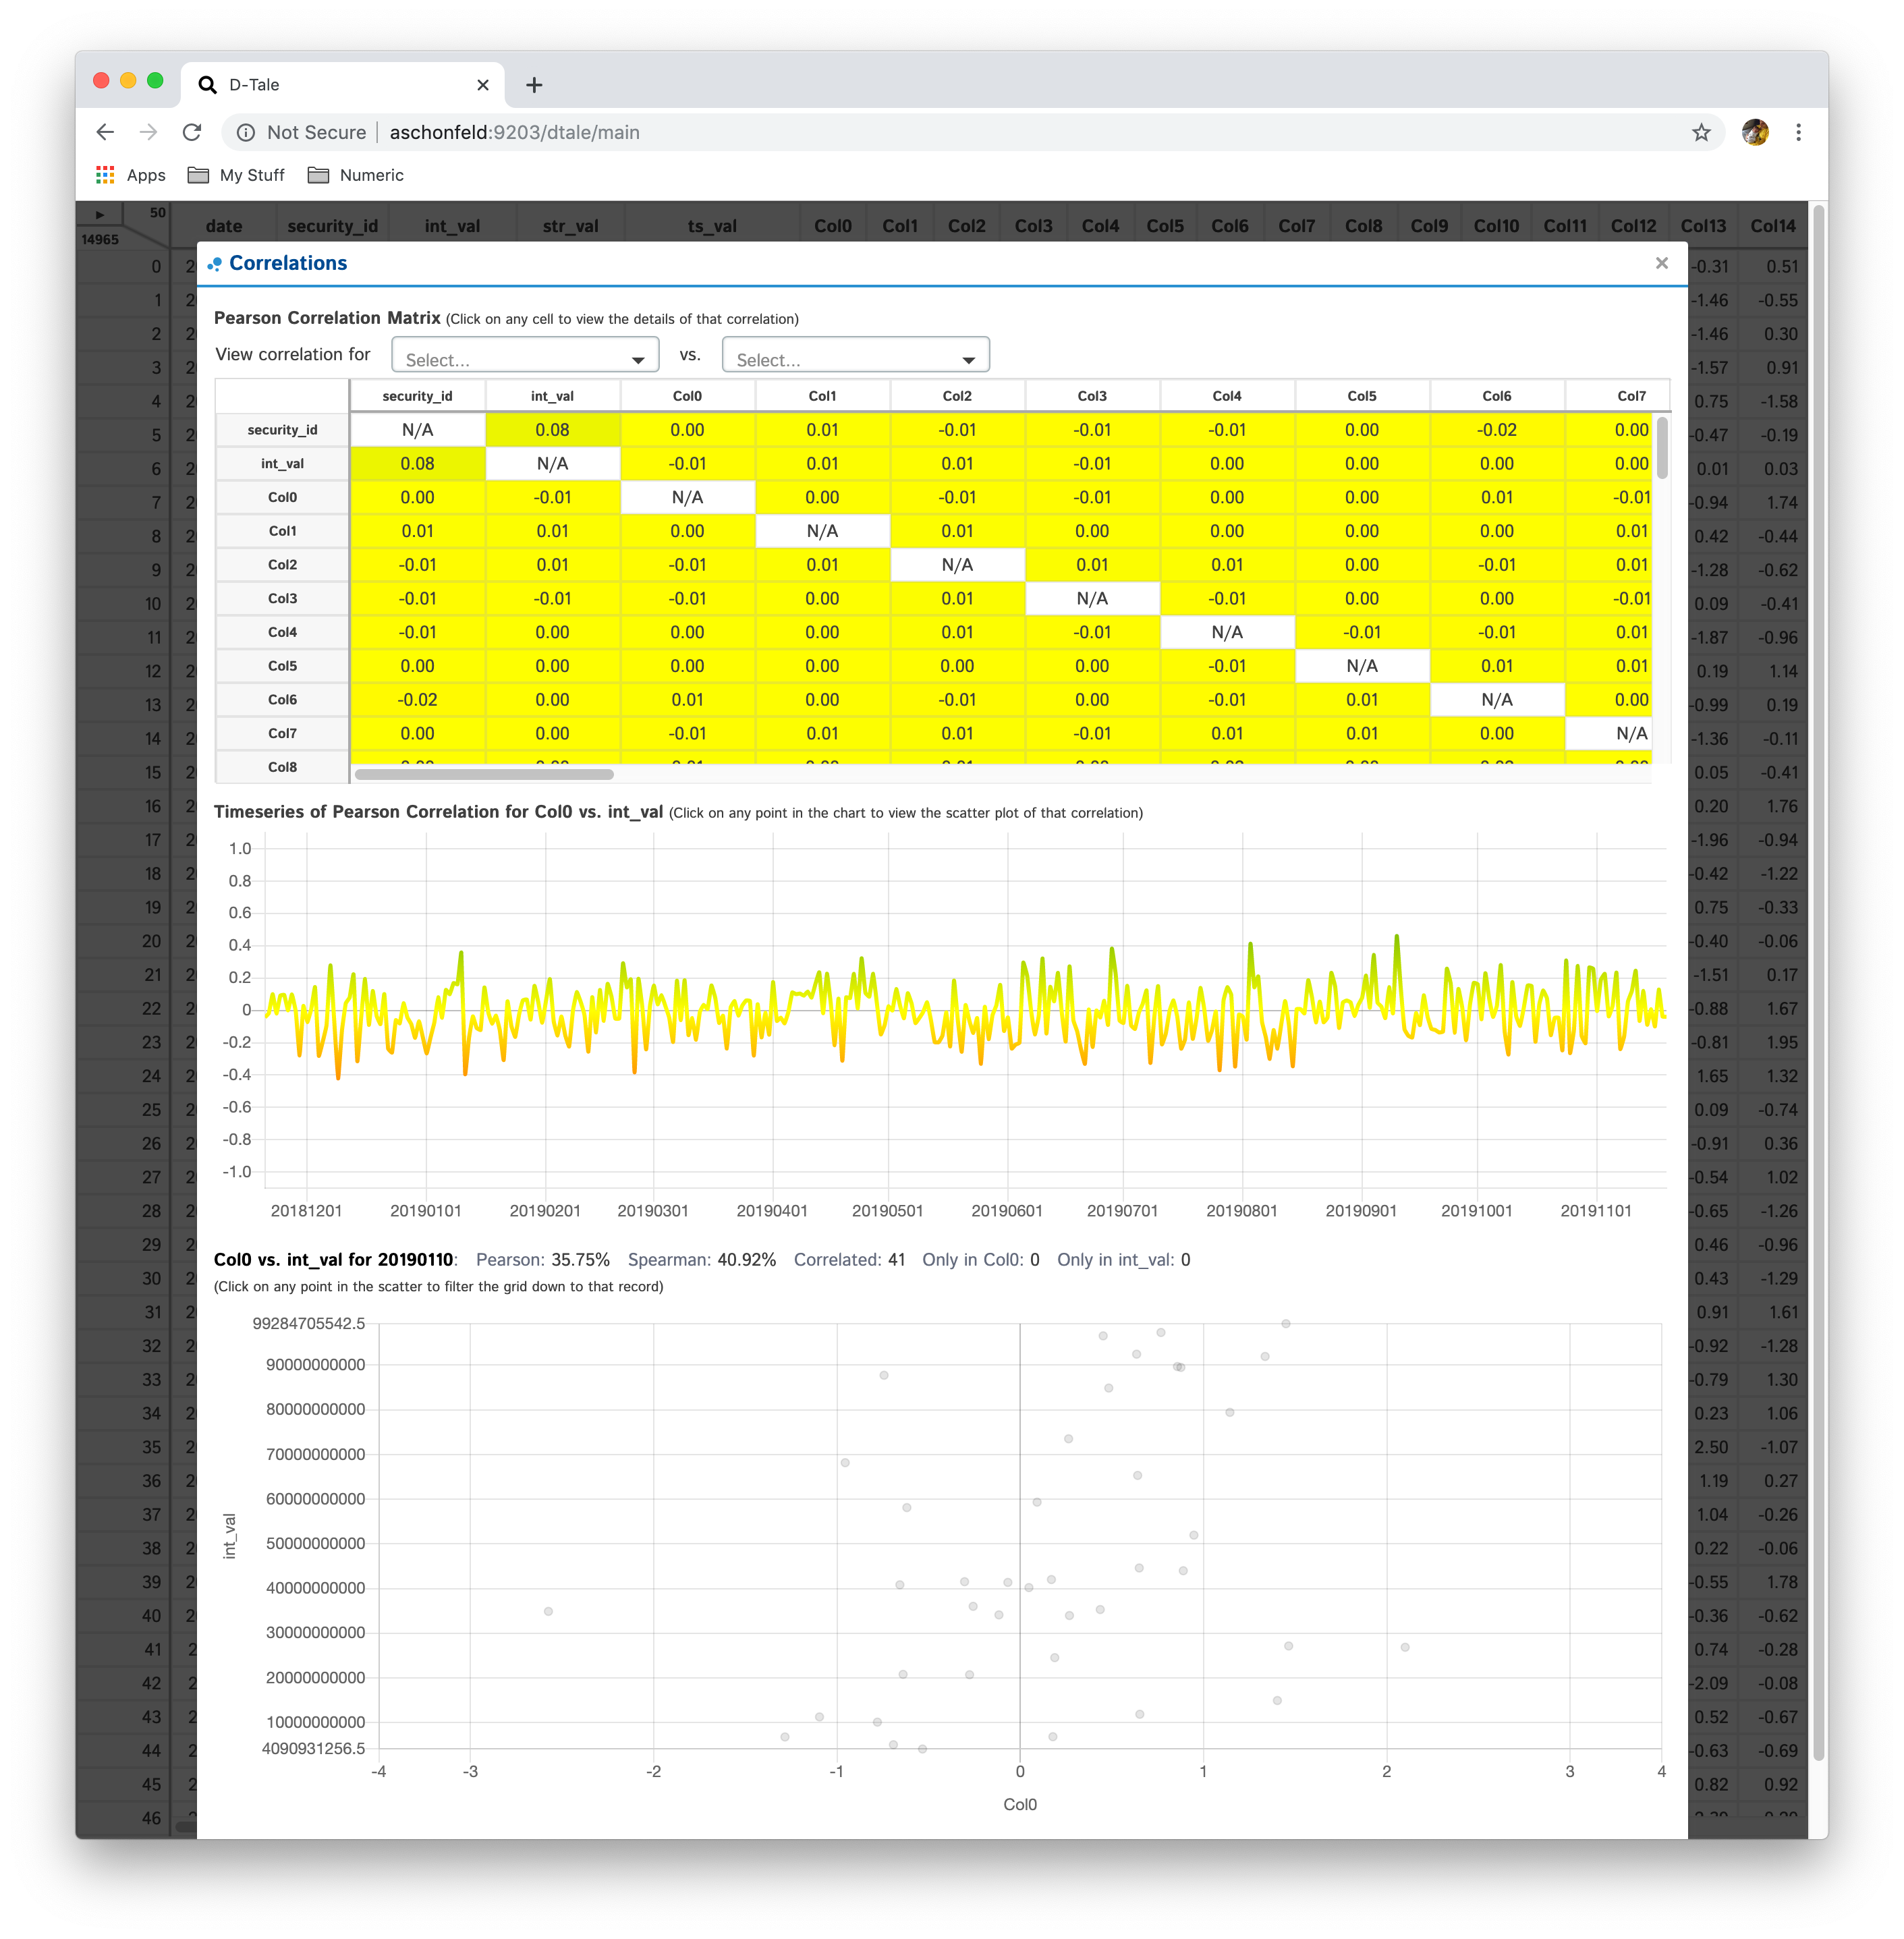 |
| Col1 Filtered | Col2 Filtered | Col1 & Col2 Filtered |
|---|---|---|
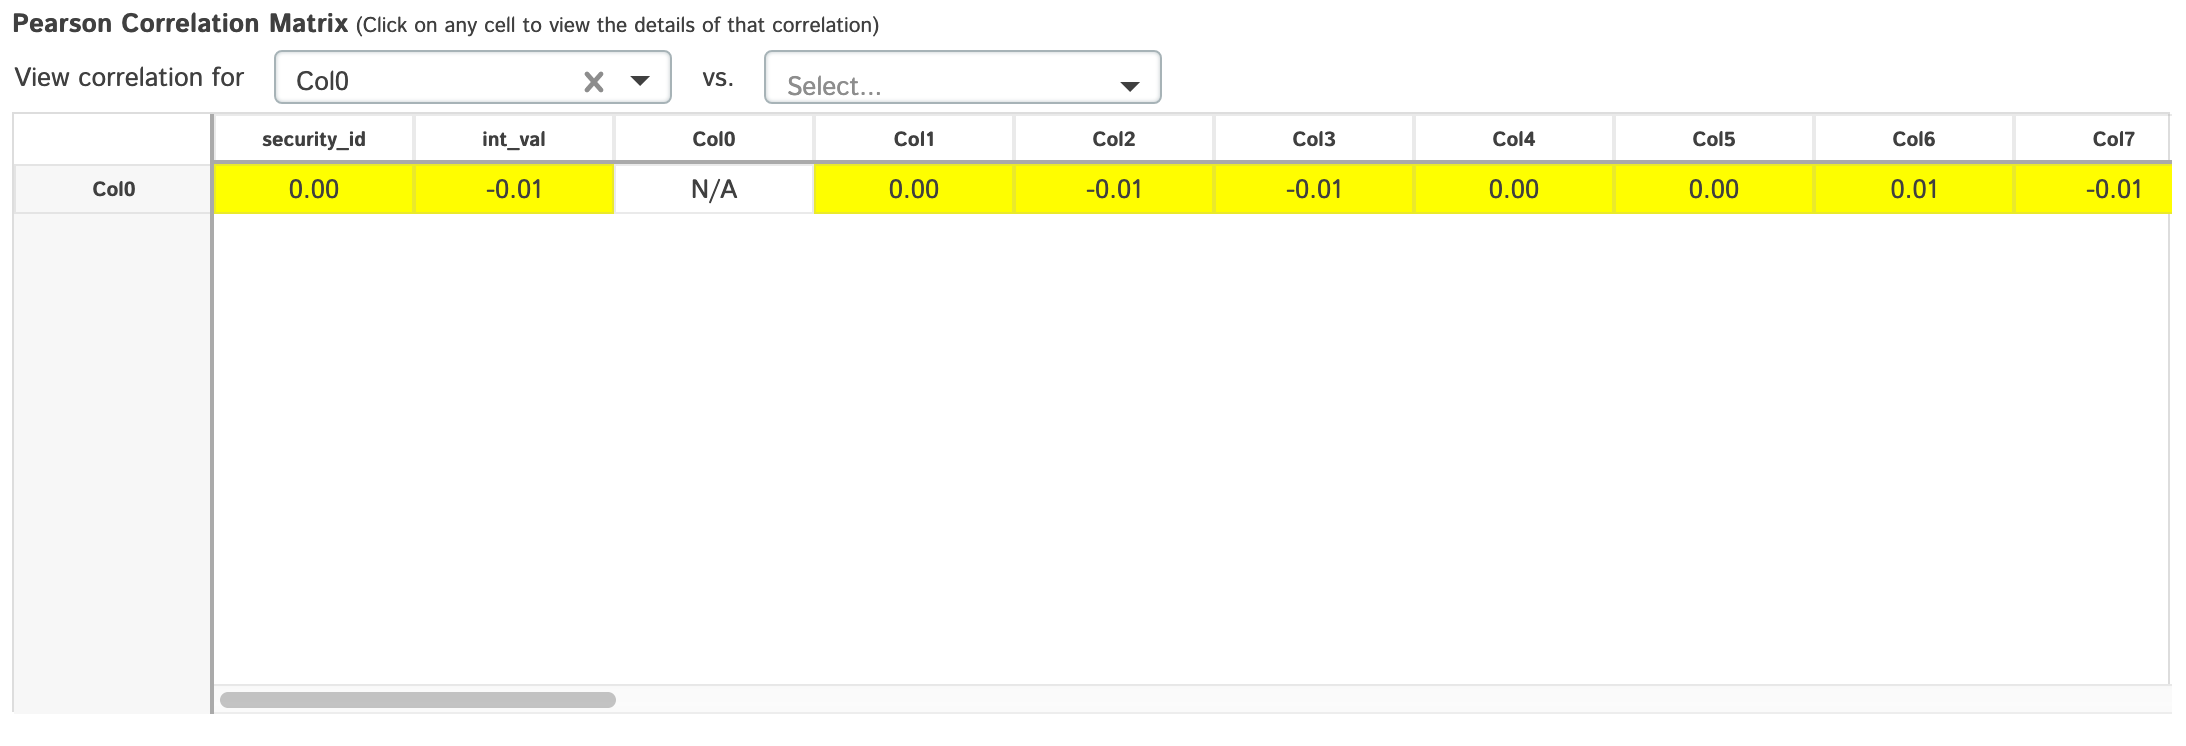 |
 |
 |
When the data being viewed in D-Tale has date or timestamp columns but for each date/timestamp vlaue there is only one row of data the behavior of the Correlations popup is a little different
| Data | Correlations |
|---|---|
 |
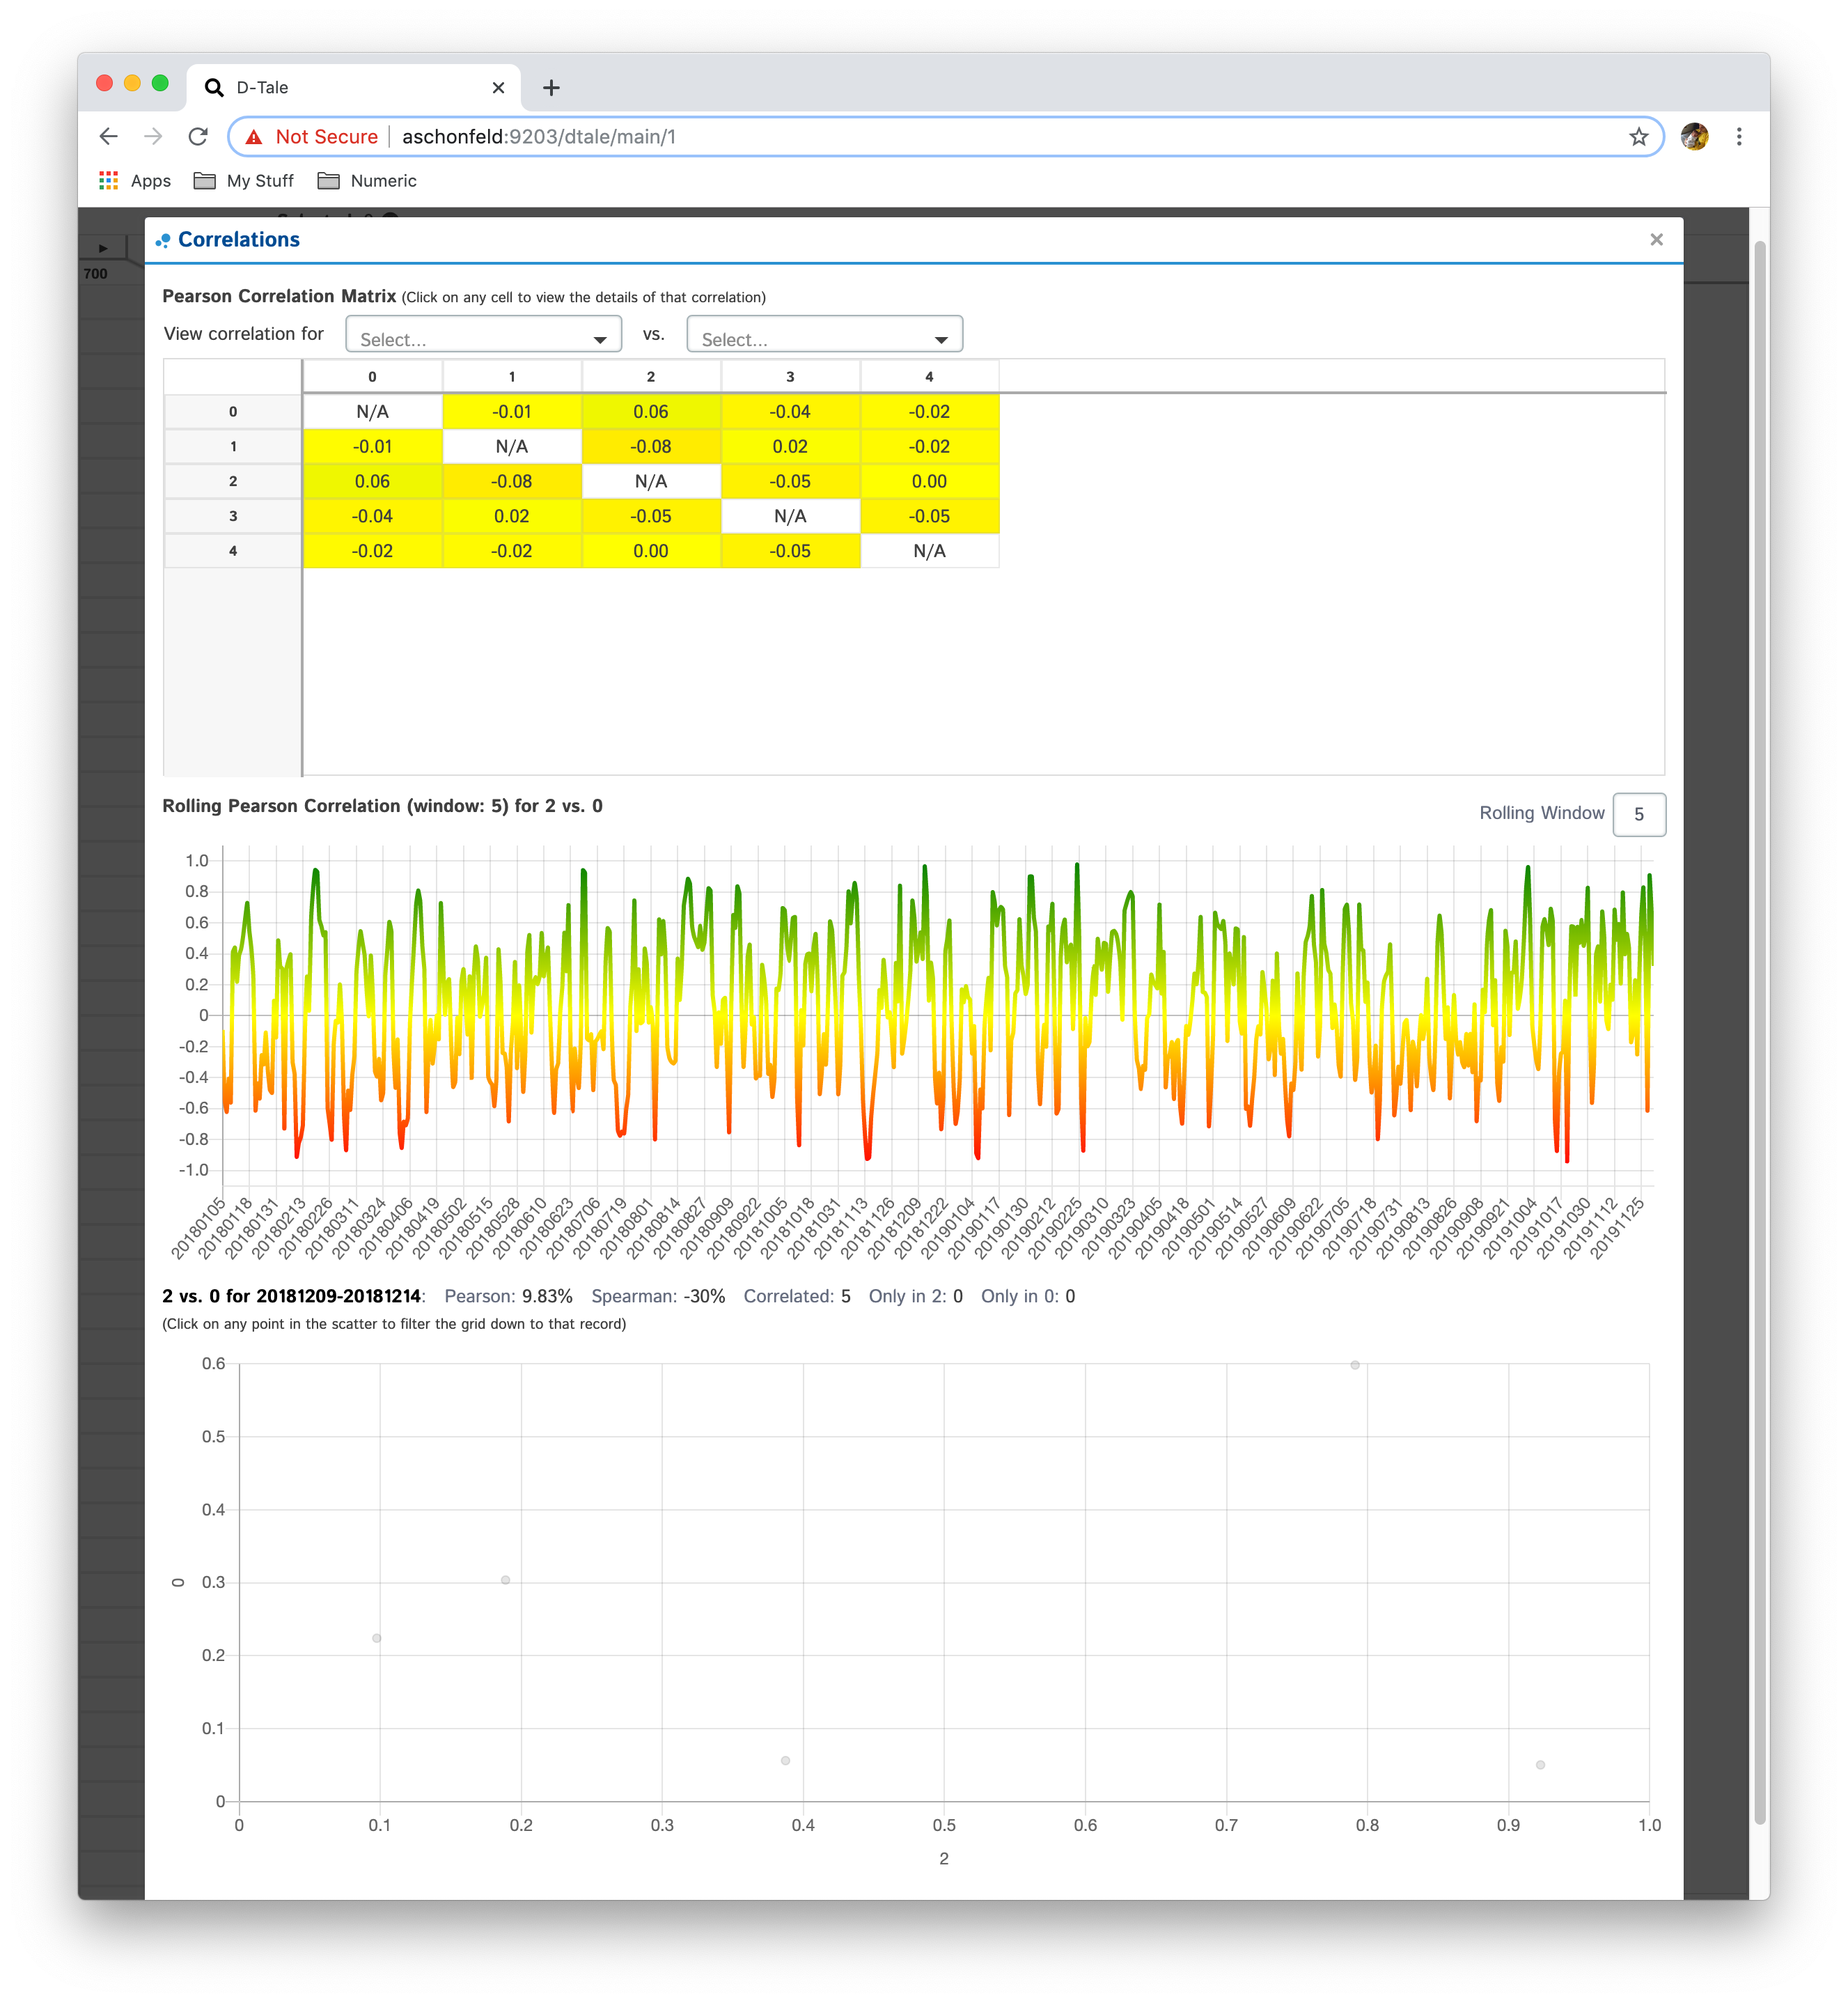 |
This will hide any non-float columns (with the exception of the index on the right) and apply a color to the background of each cell
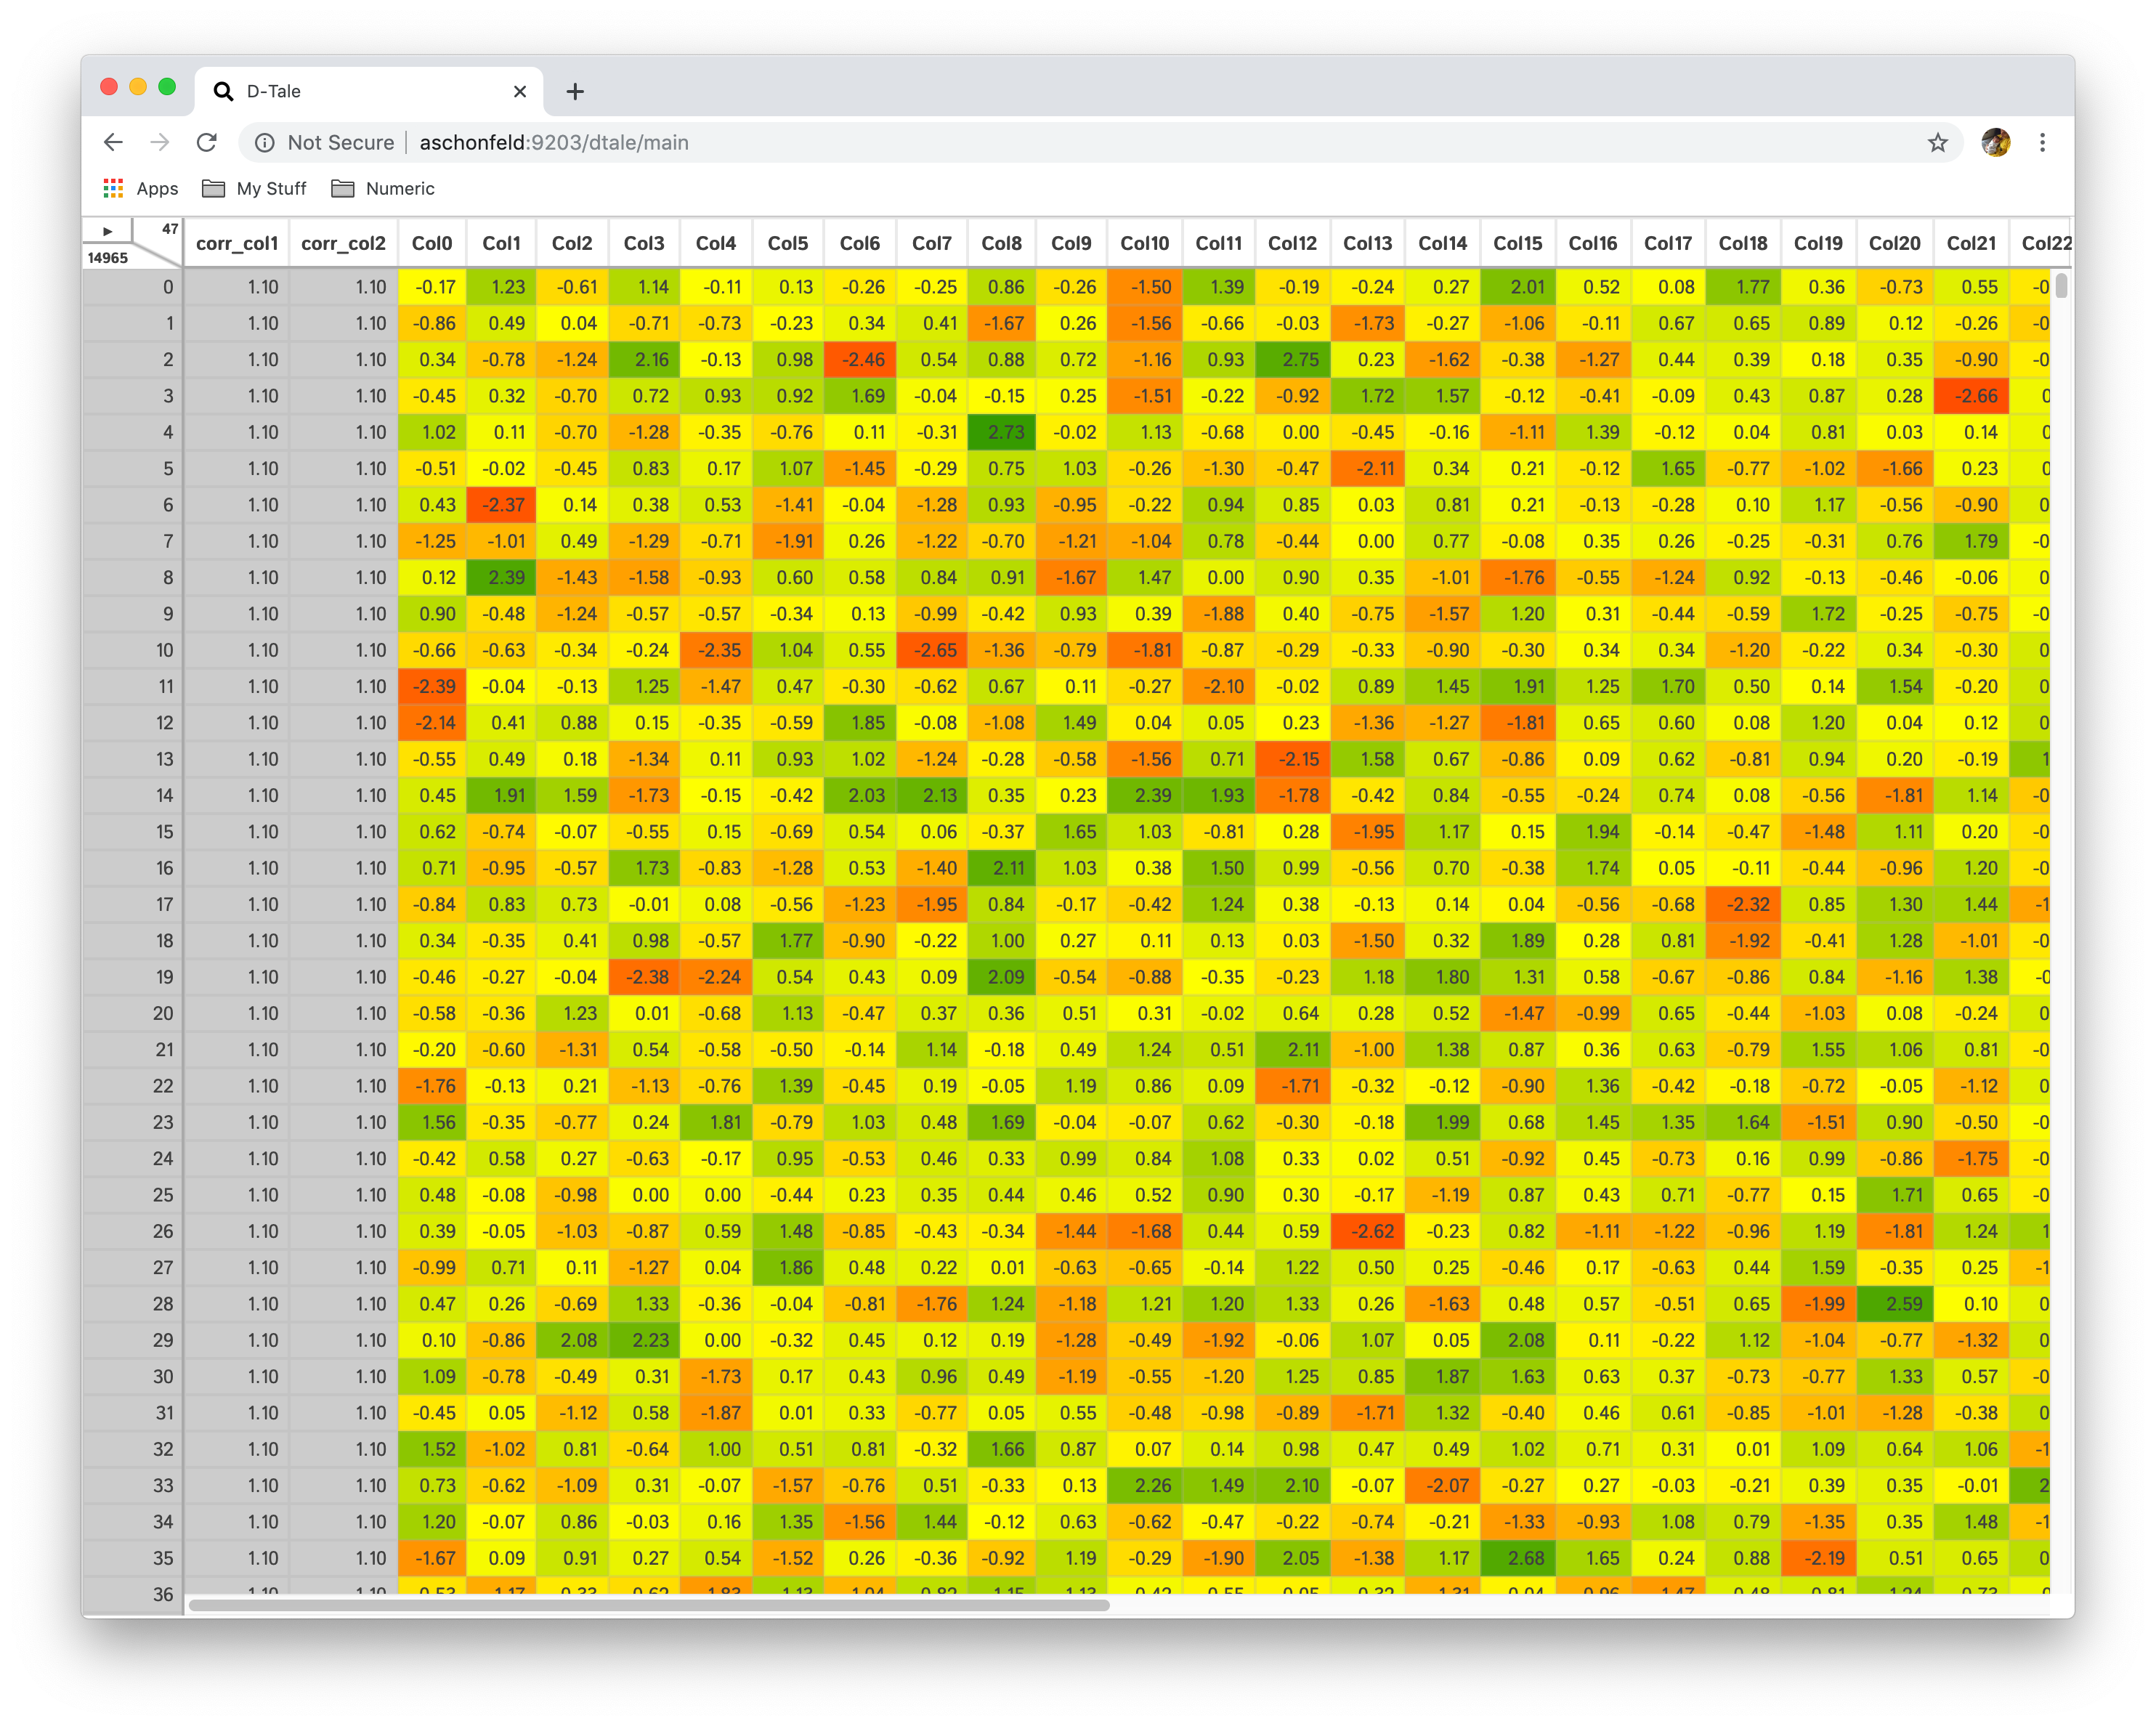
Turn off Heat Map by clicking menu option again
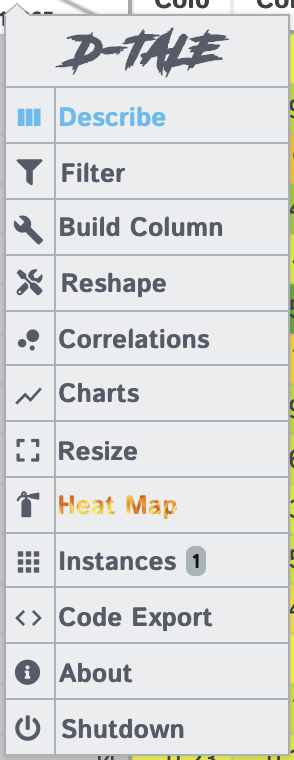
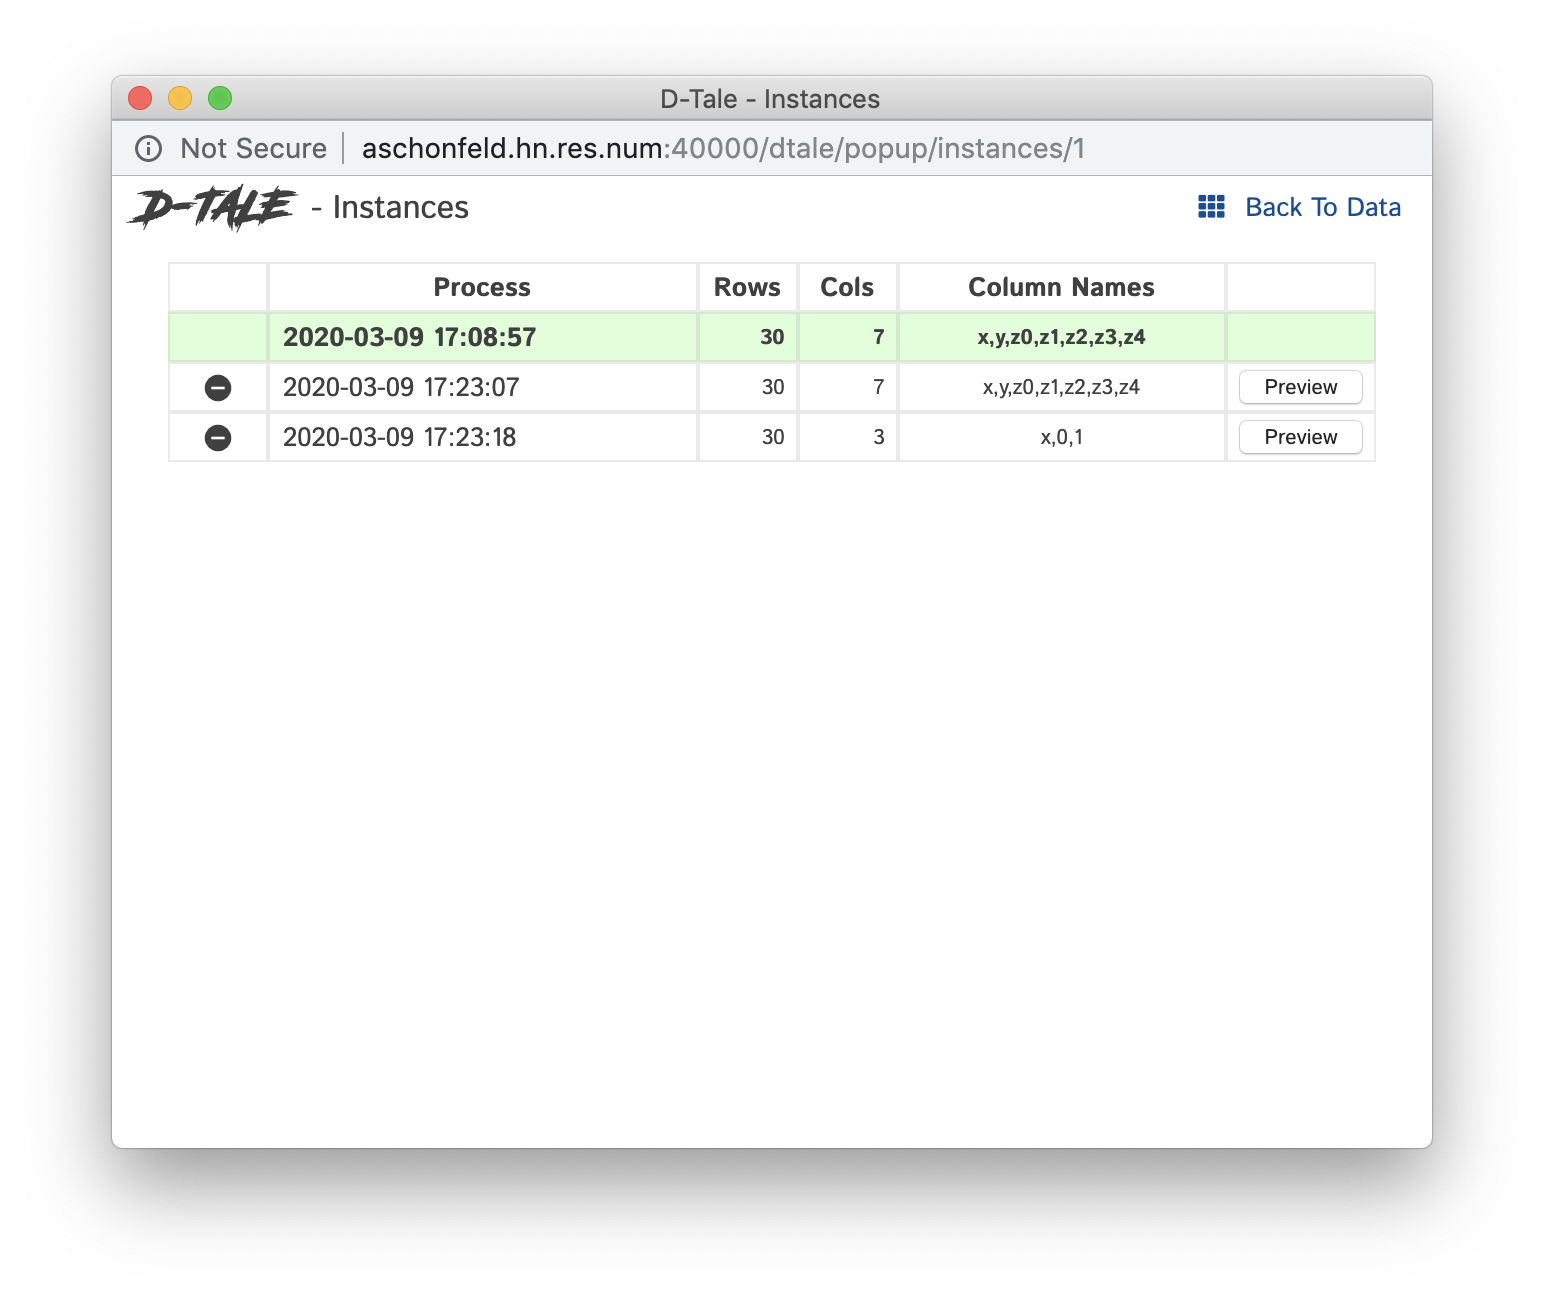
This will give you information about other D-Tale instances are running under your current Python process.
For example, if you ran the following script:
import pandas as pd
import dtale

dtale.show(pd.DataFrame([dict(foo=1, bar=2, biz=3, baz=4, snoopy_D_O_double_gizzle=5)]))
dtale.show(pd.DataFrame([
    dict(a=1, b=2, c=3, d=4),
    dict(a=2, b=3, c=4, d=5),
    dict(a=3, b=4, c=5, d=6),
    dict(a=4, b=5, c=6, d=7)
]))
dtale.show(pd.DataFrame([range(6), range(6), range(6), range(6), range(6), range(6)]), name="foo")
This will make the Instances button available in all 3 of these D-Tale instances. Clicking that button while in the first instance invoked above will give you this popup:
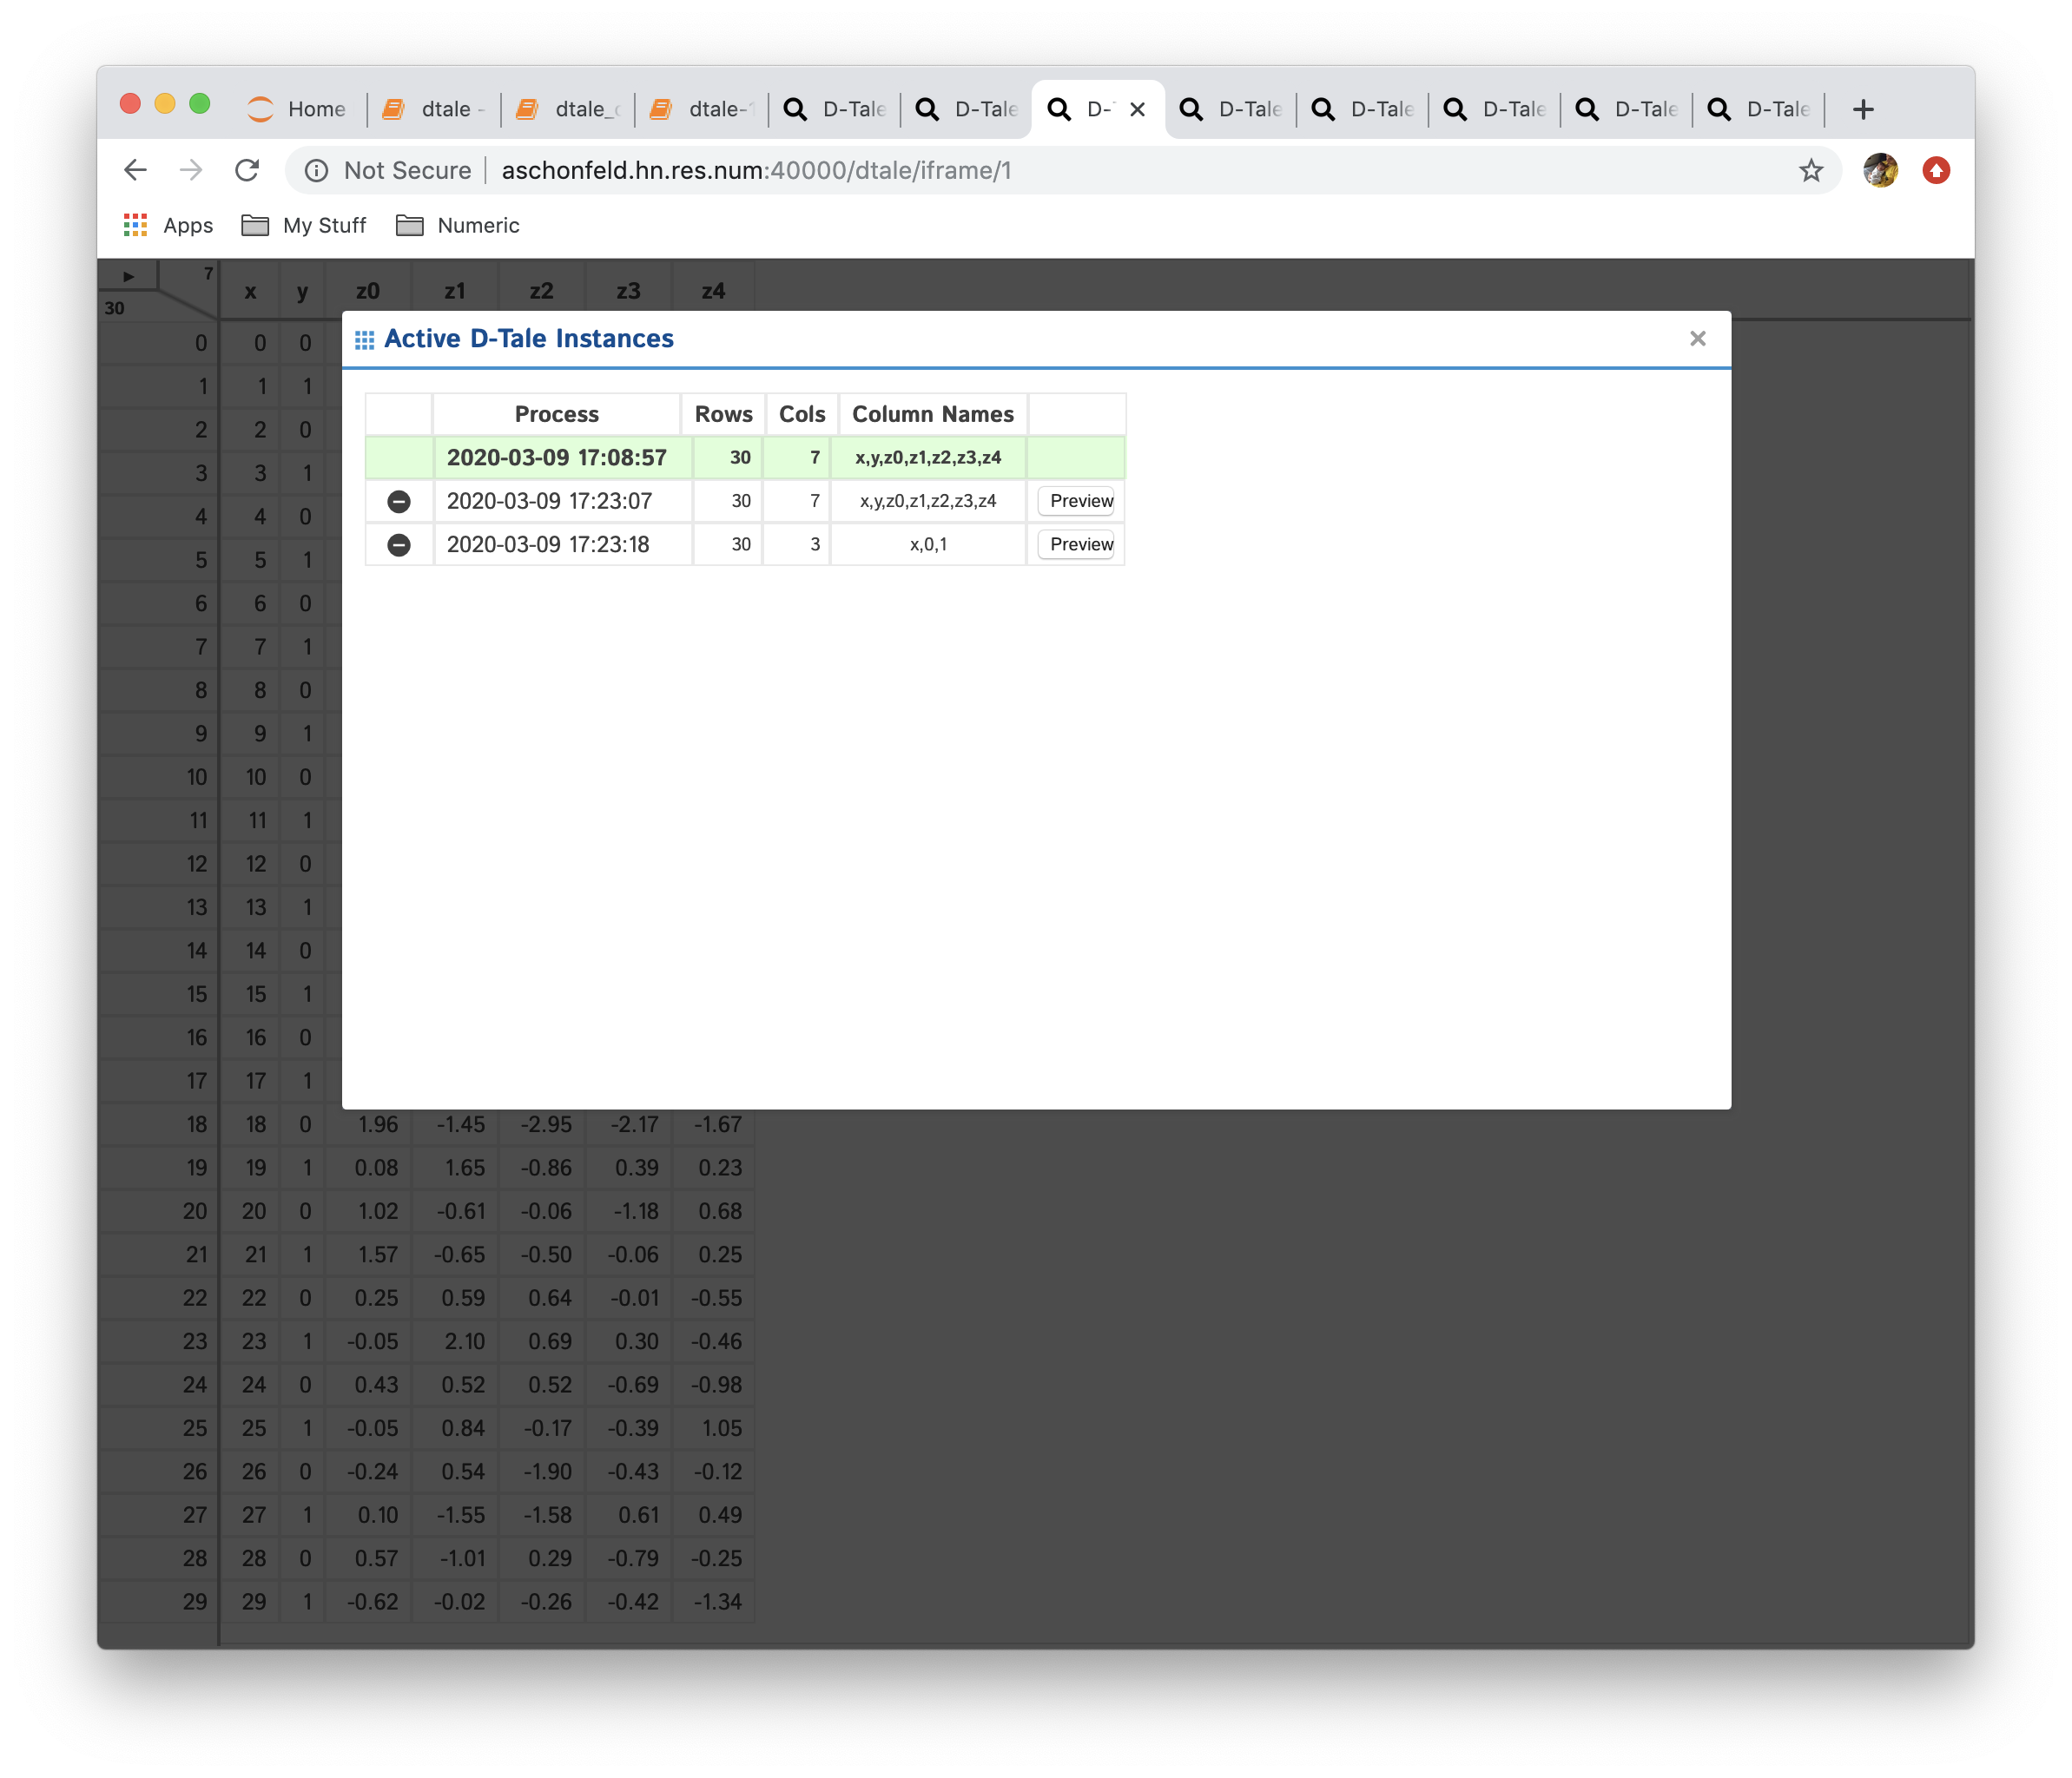
The grid above contains the following information:
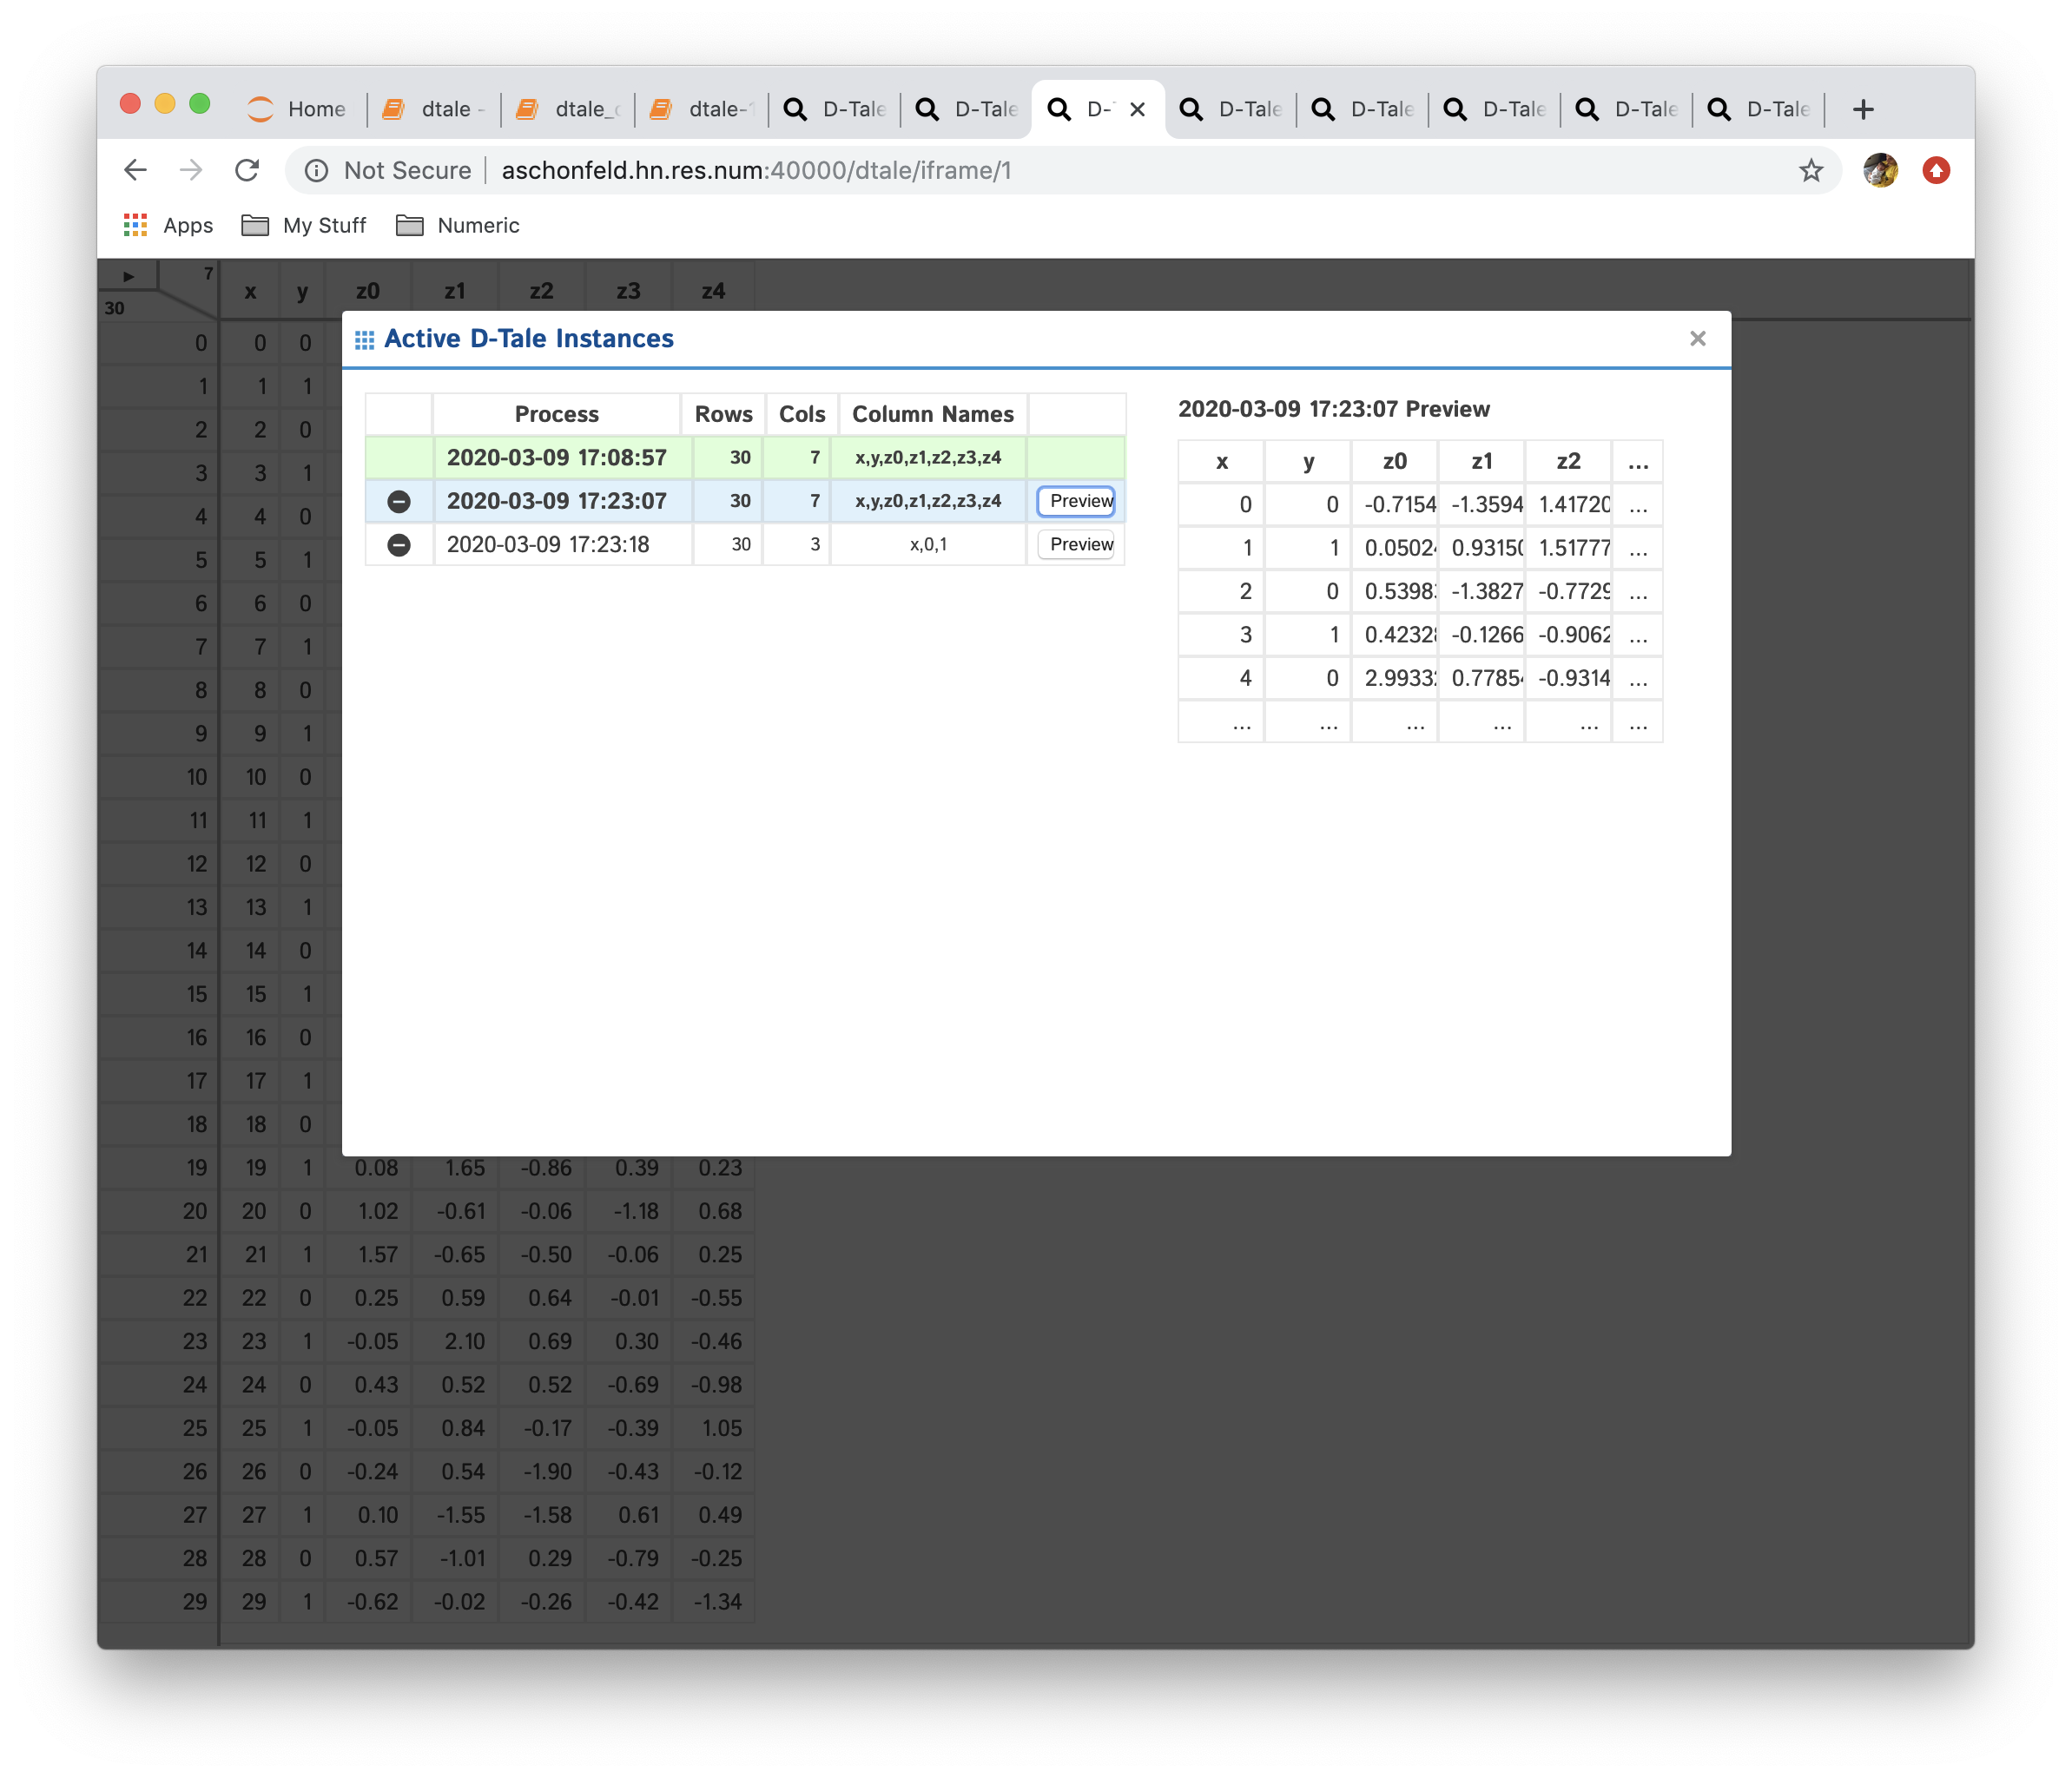
dtale.show())Here is an example of clicking the "Preview" button:
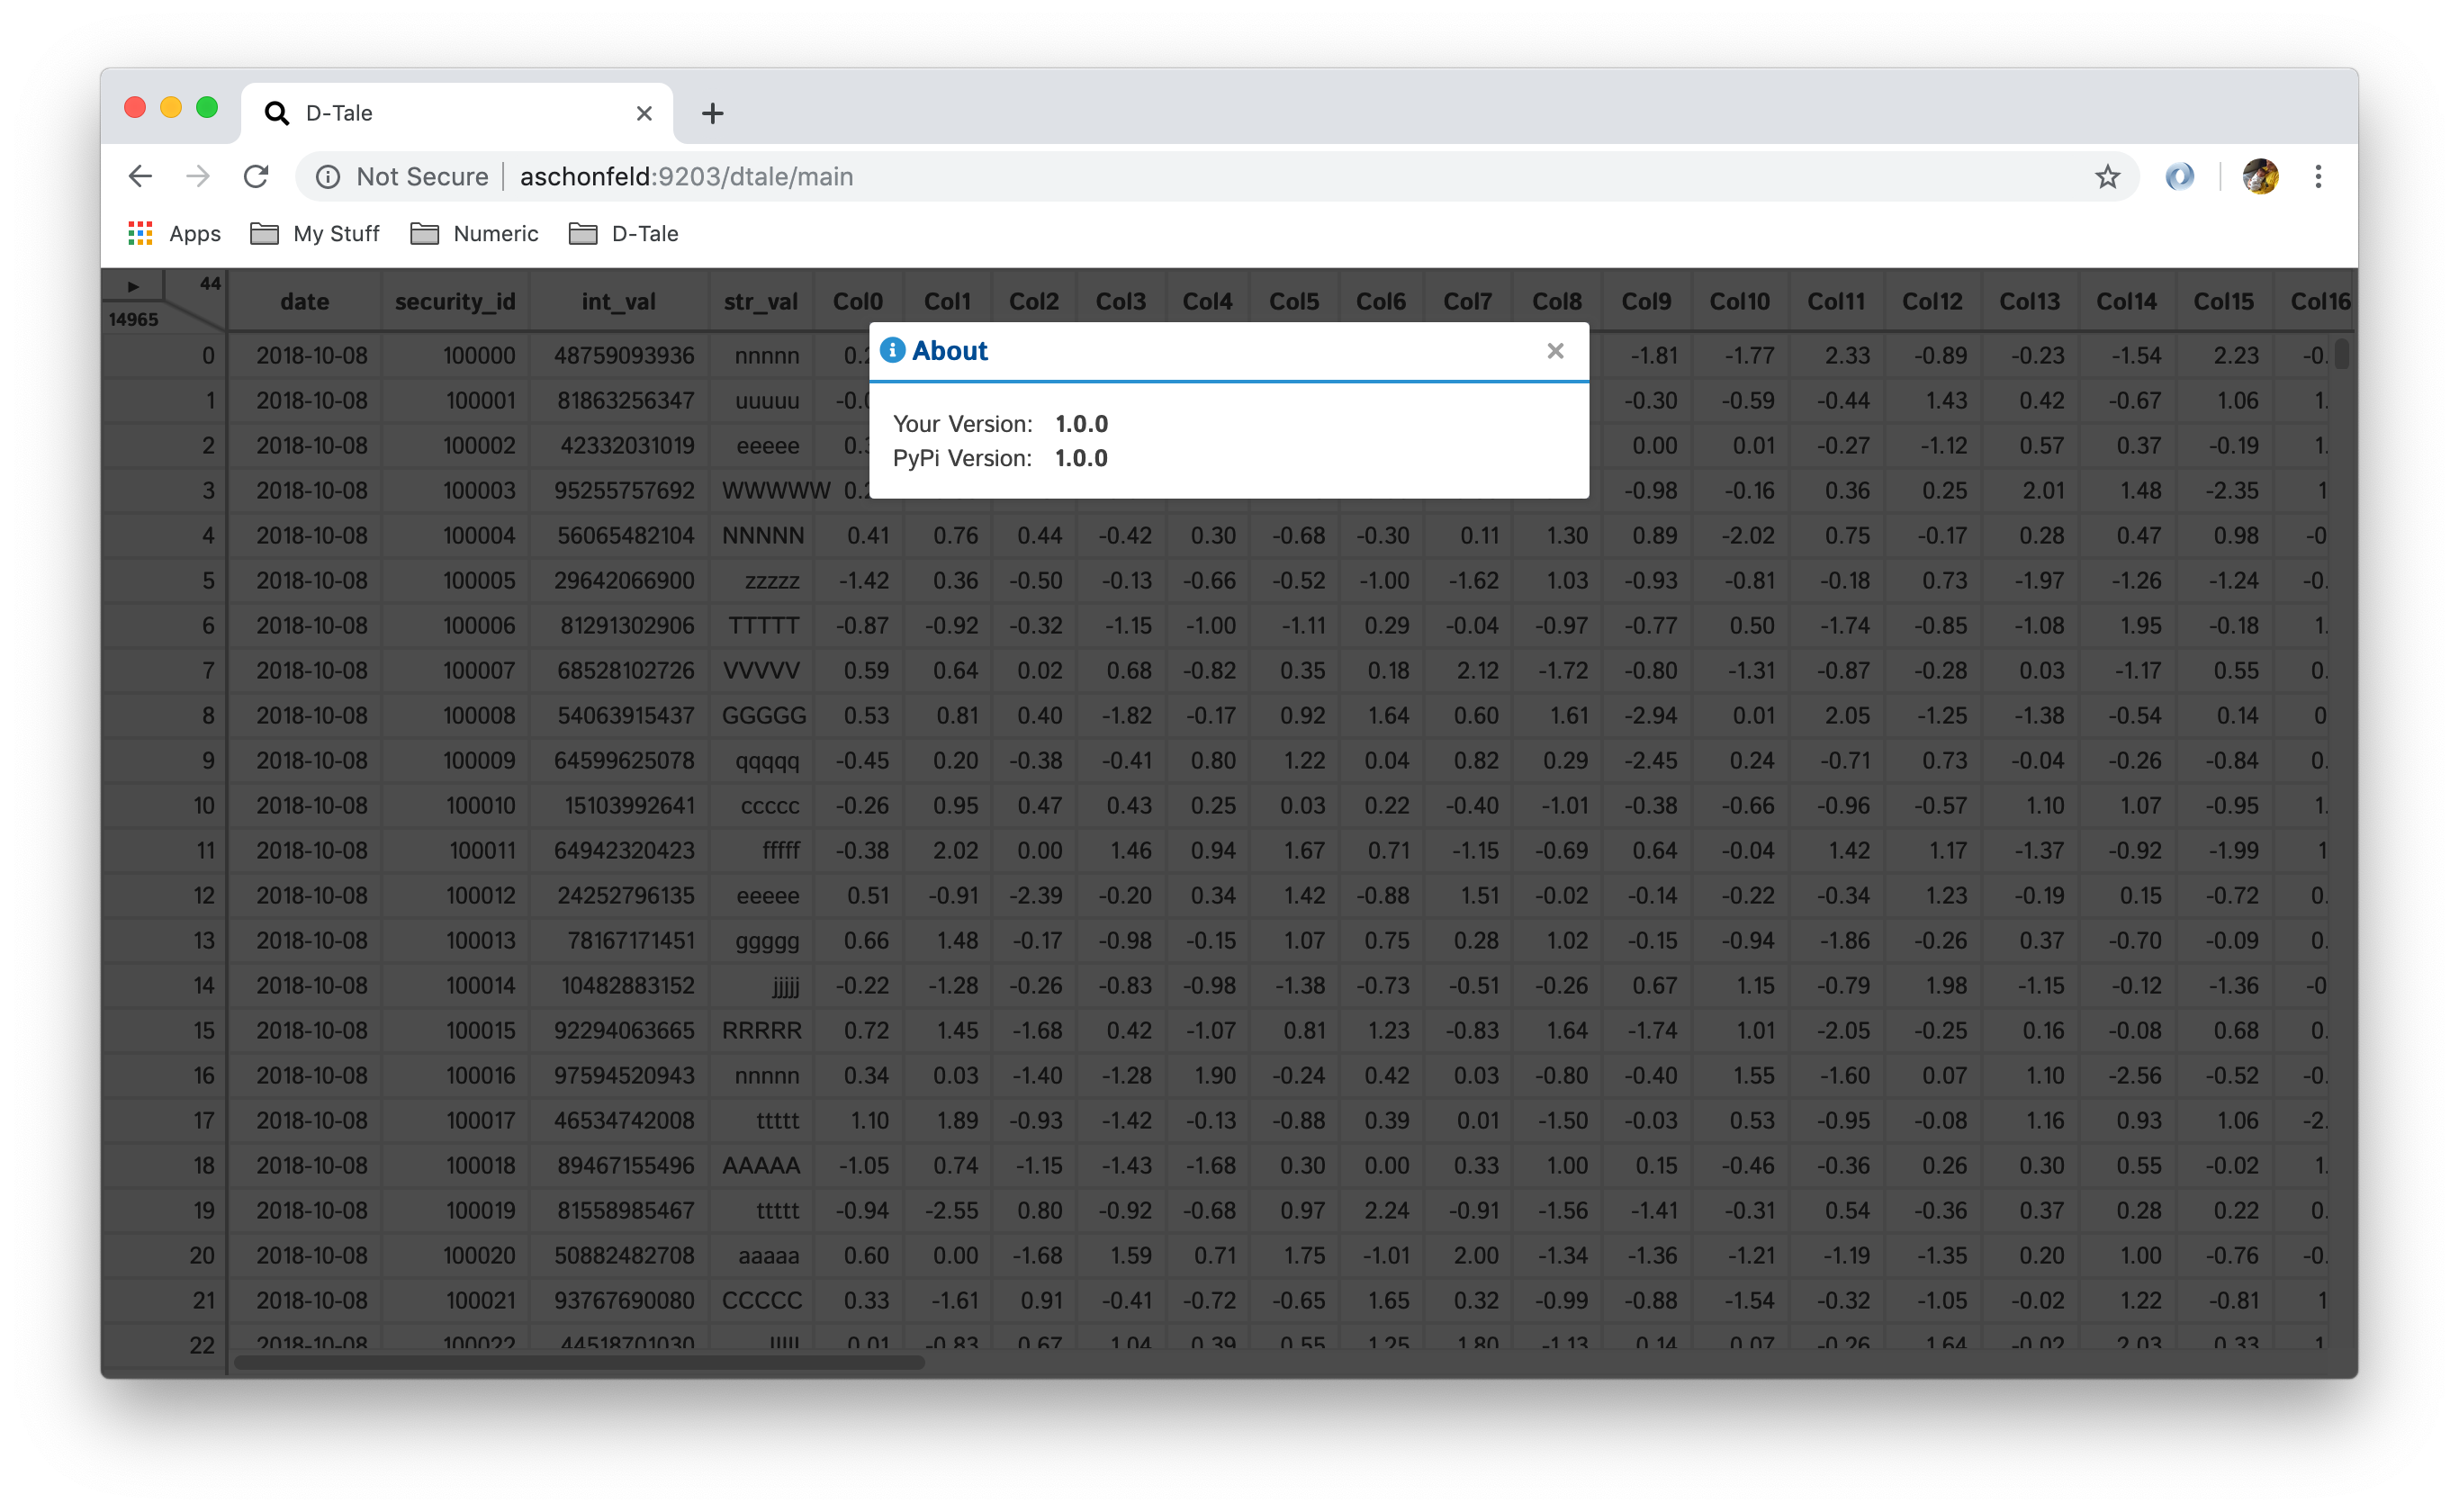
This will give you information about what version of D-Tale you're running as well as if its out of date to whats on PyPi.
| Up To Date | Out Of Date |
|---|---|
 |
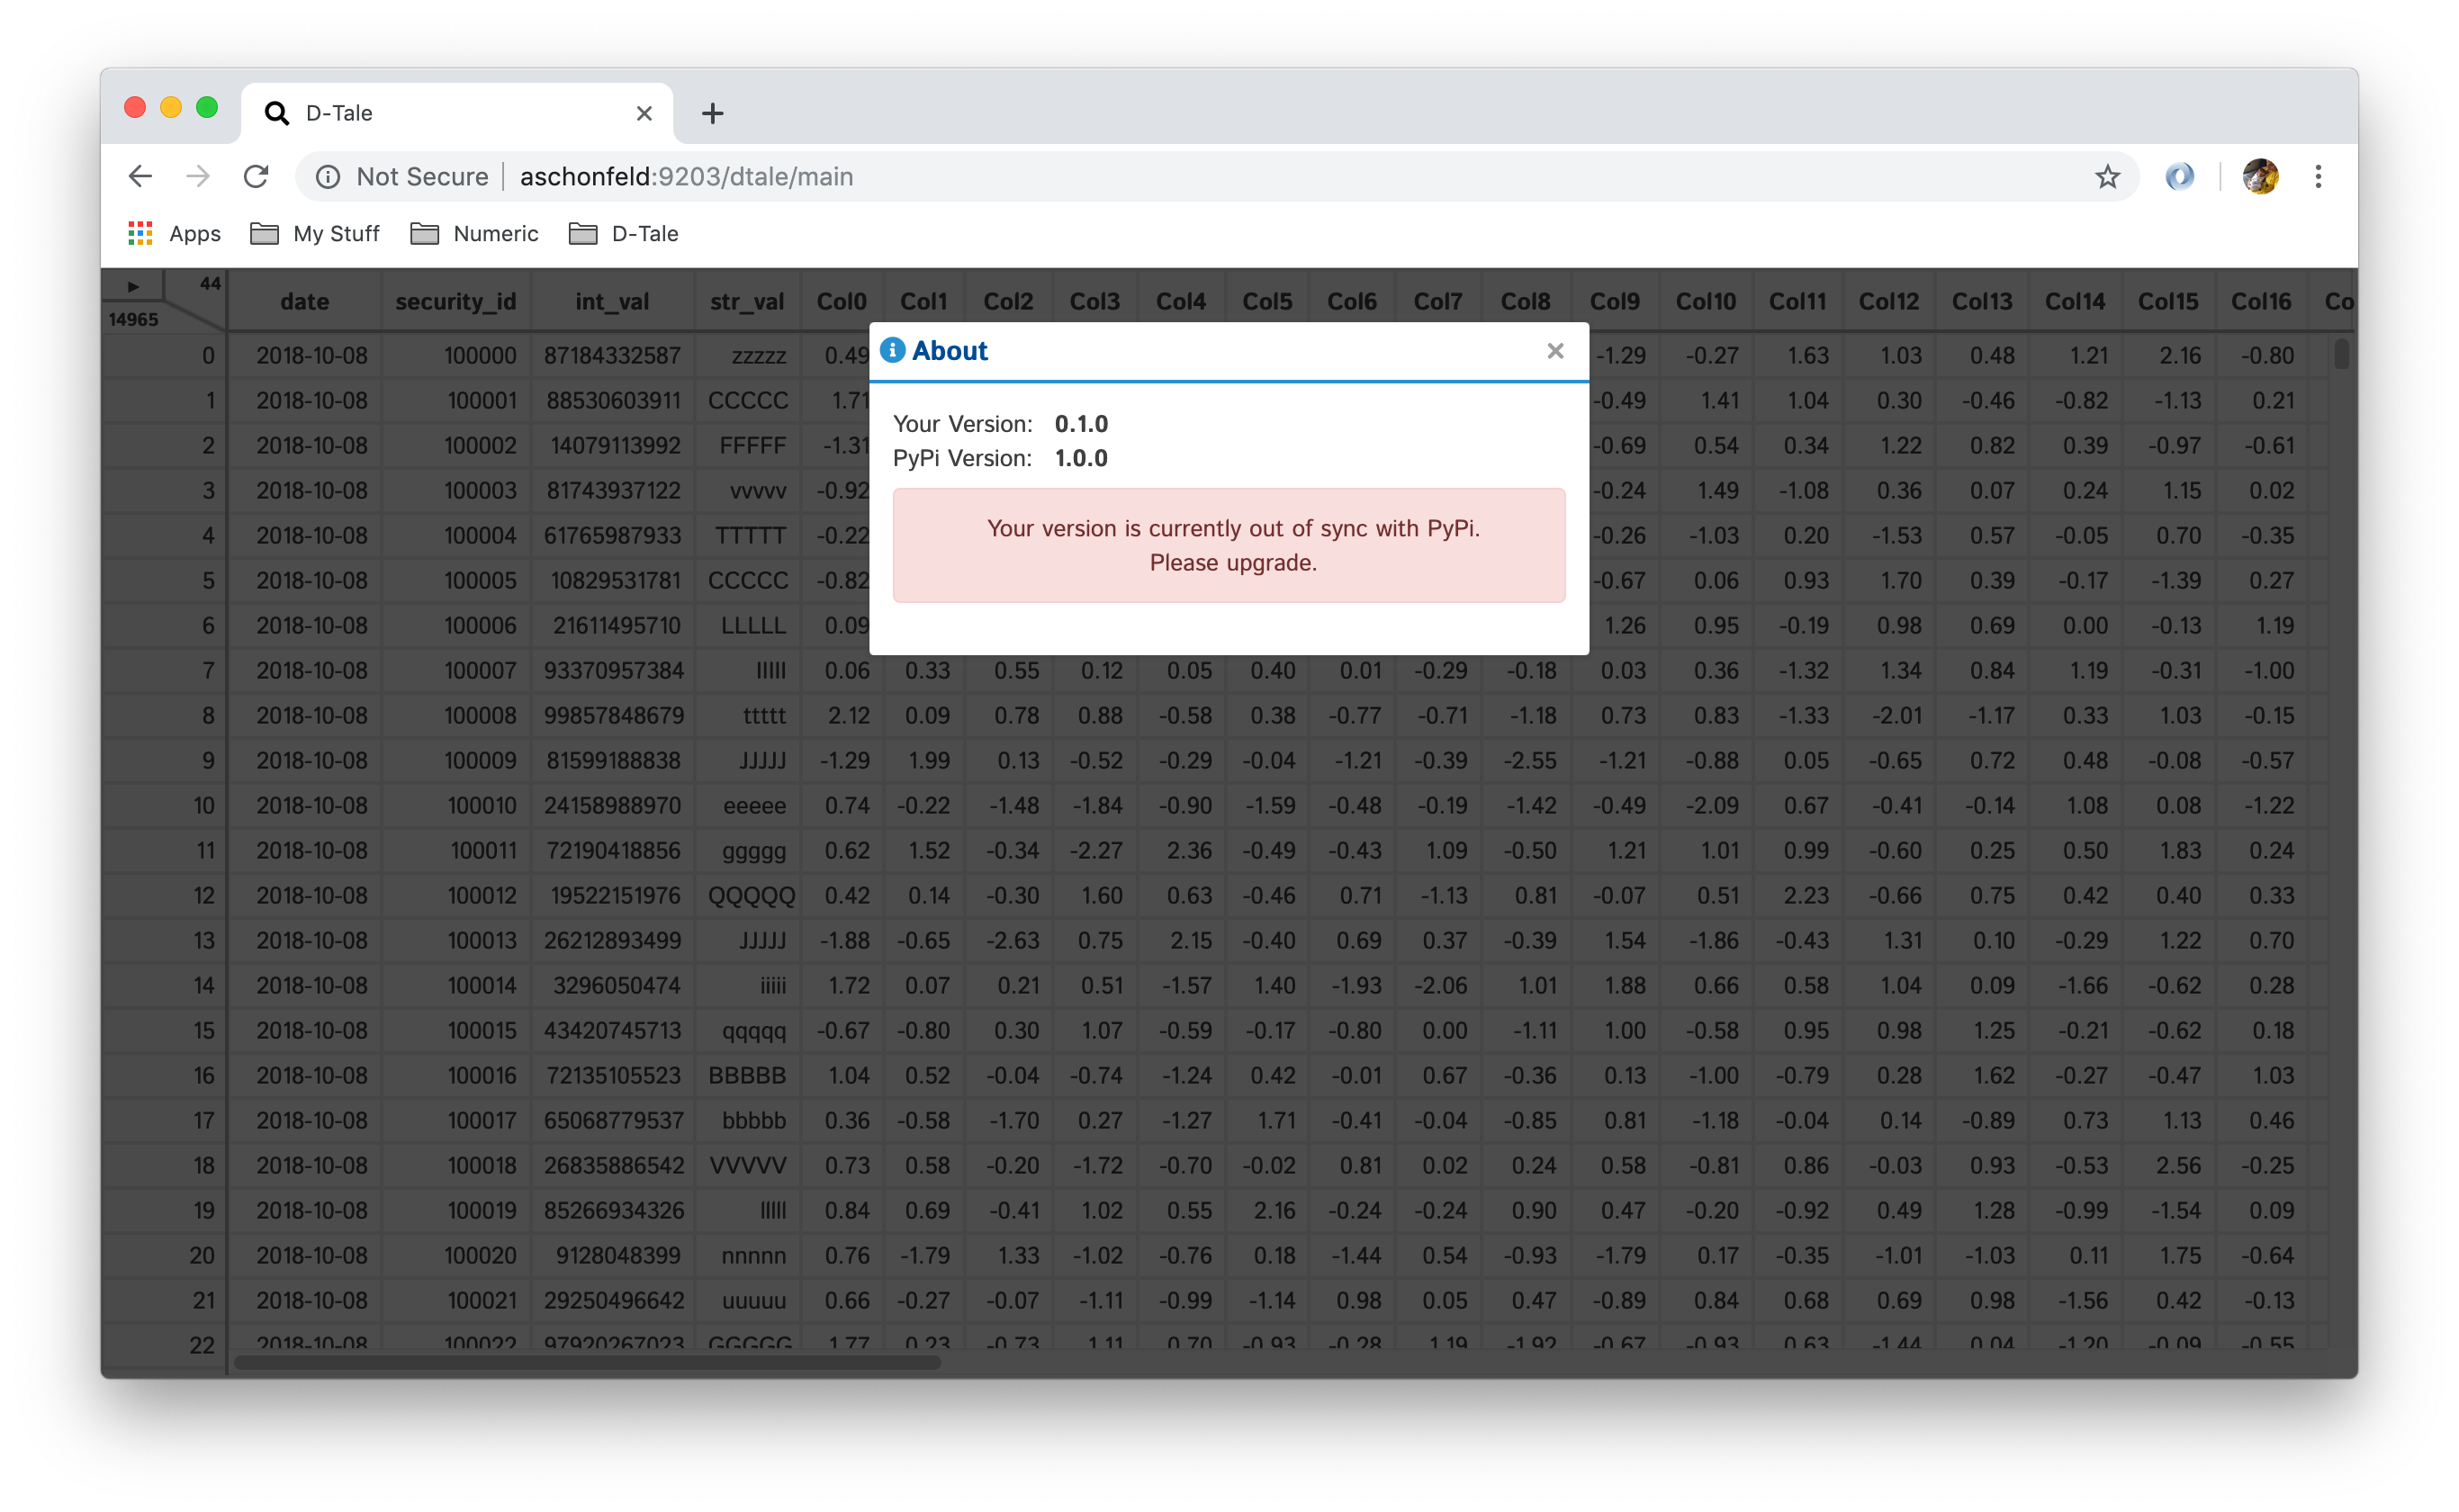 |
Mostly a fail-safe in the event that your columns are no longer lining up. Click this and should fix that
Pretty self-explanatory, kills your D-Tale session (there is also an auto-kill process that will kill your D-Tale after an hour of inactivity)
All column movements are saved on the server so refreshing your browser won't lose them
All column movements are saved on the server so refreshing your browser won't lose them
This video shows you how to build the following:
Adds your column to "locked" columns
Removed column from "locked" columns
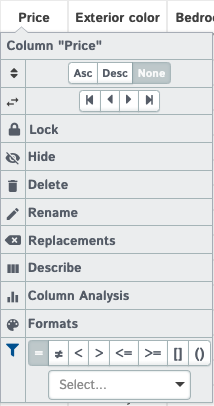
Applies/removes sorting (Ascending/Descending/Clear) to the column selected
Important: as you add sorts they sort added will be added to the end of the multi-sort. For example:
| Action | Sort |
|---|---|
| click "a" | |
| sort asc | a (asc) |
| click "b" | a (asc) |
| sort desc | a (asc), b(desc) |
| click "a" | a (asc), b(desc) |
| sort None | b(desc) |
| sort desc | b(desc), a(desc) |
| click "X" on sort display |
Apply simple formats to numeric values in your grid
| Type | Editing | Result |
|---|---|---|
| Numeric |  |
 |
| Date | 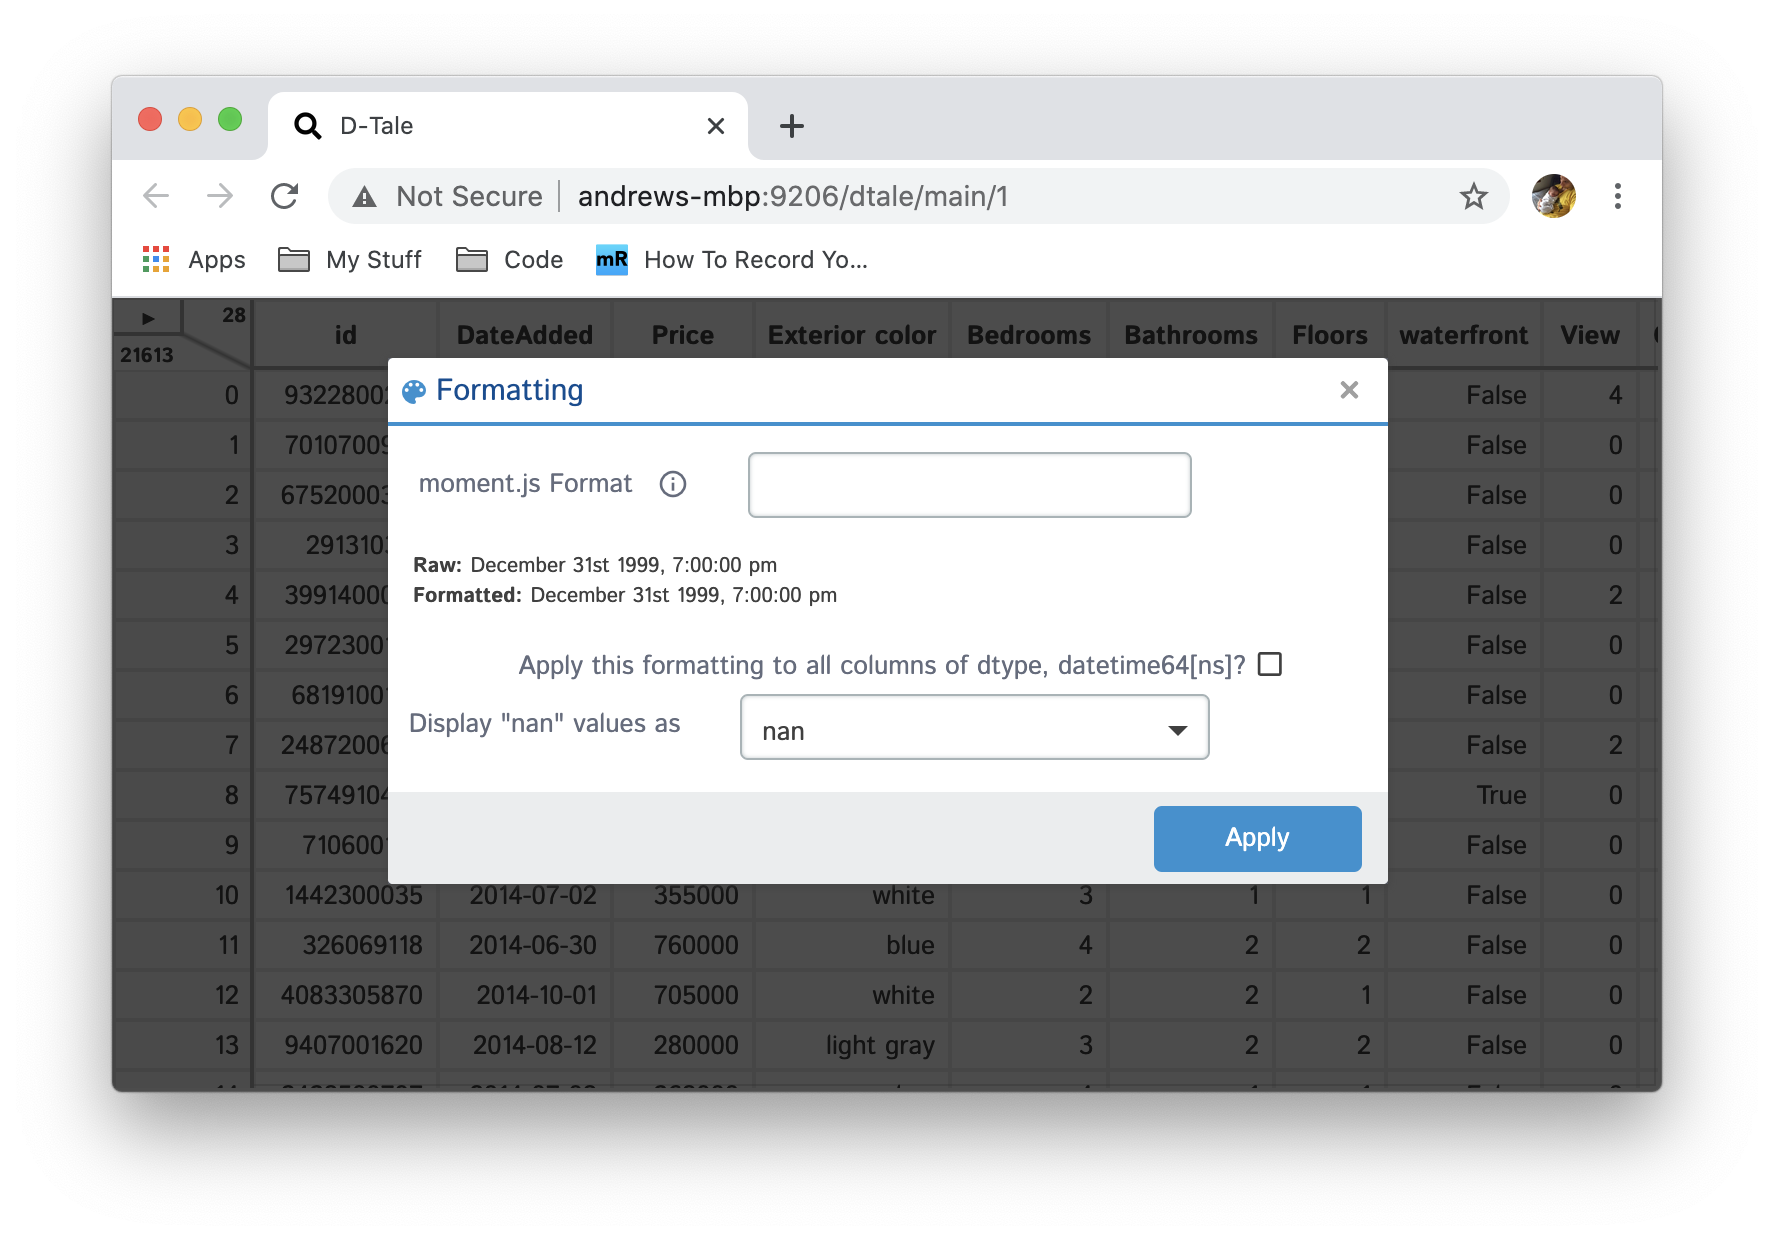 |
 |
| String | 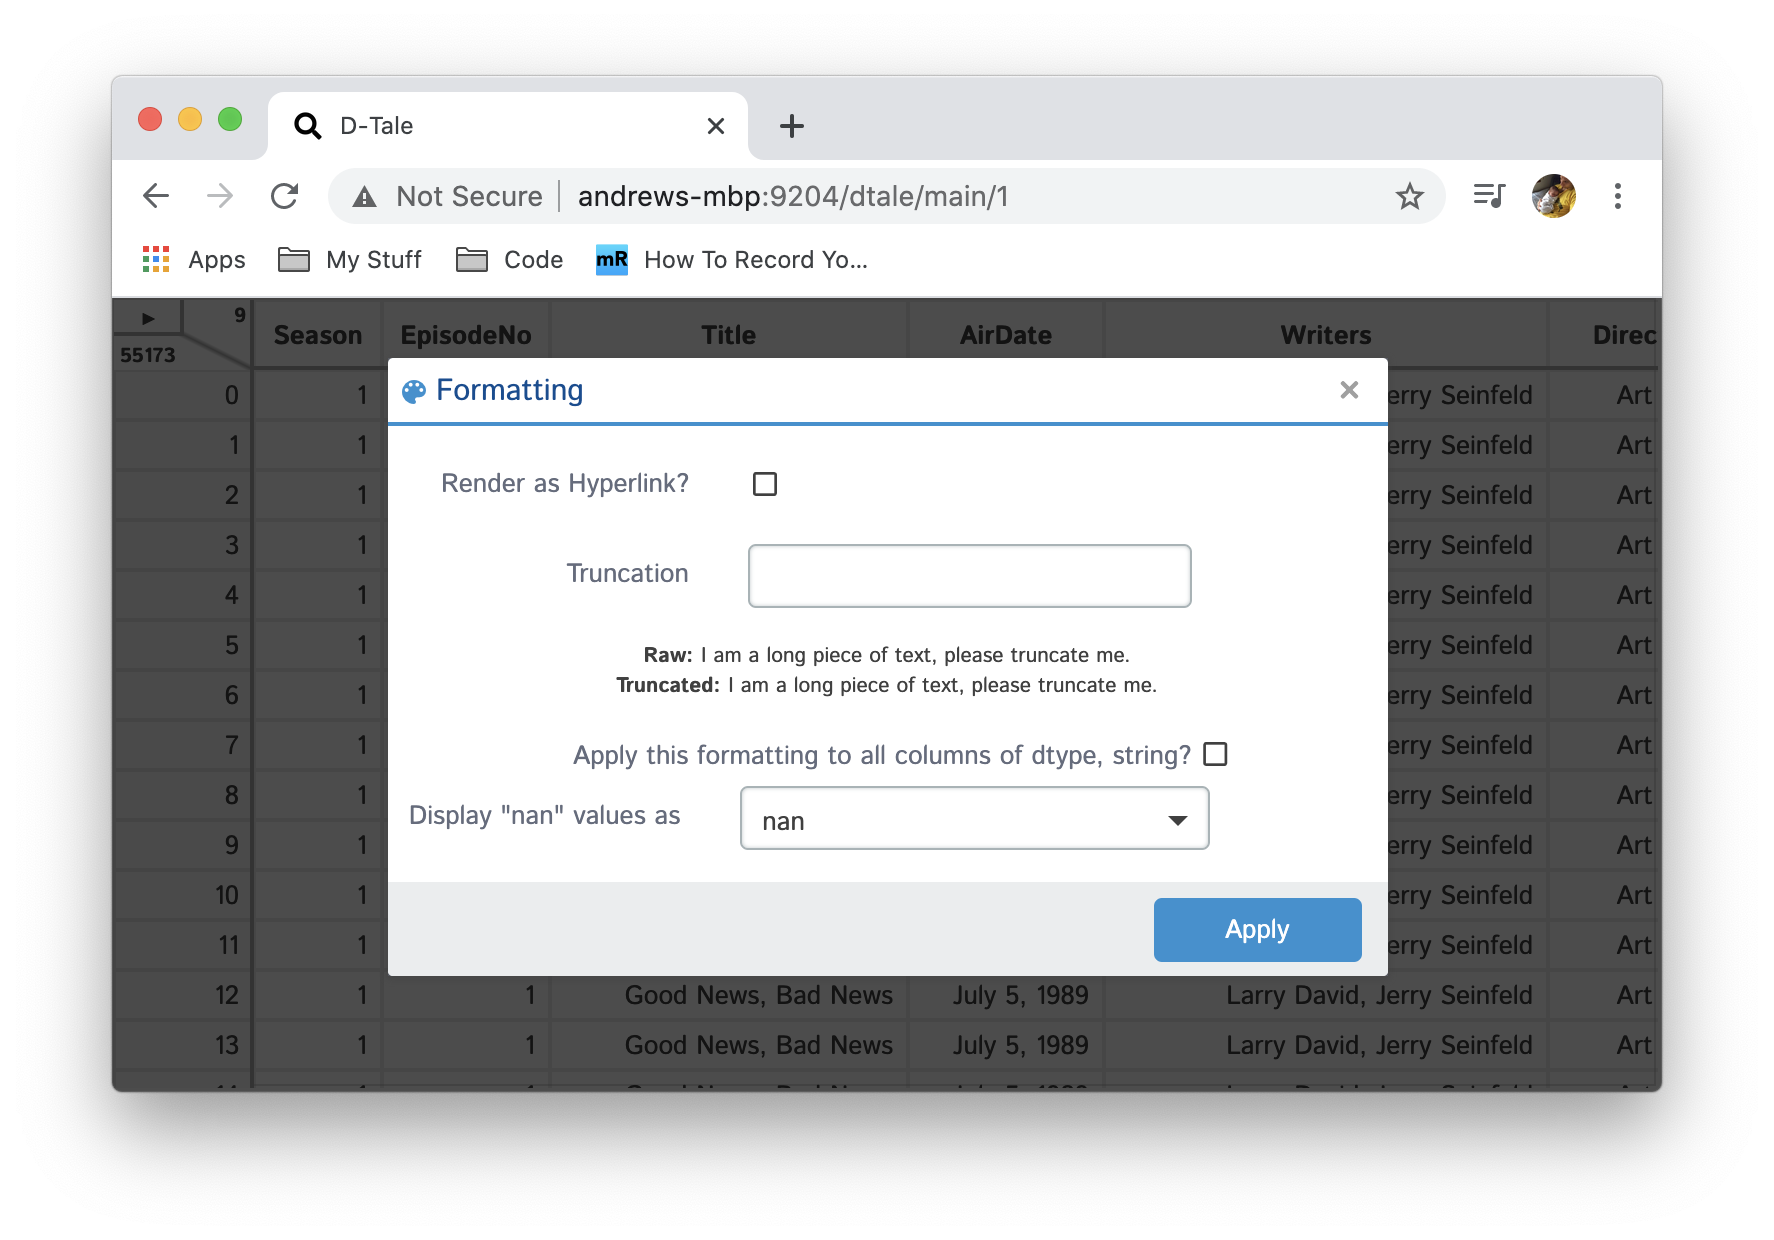 |
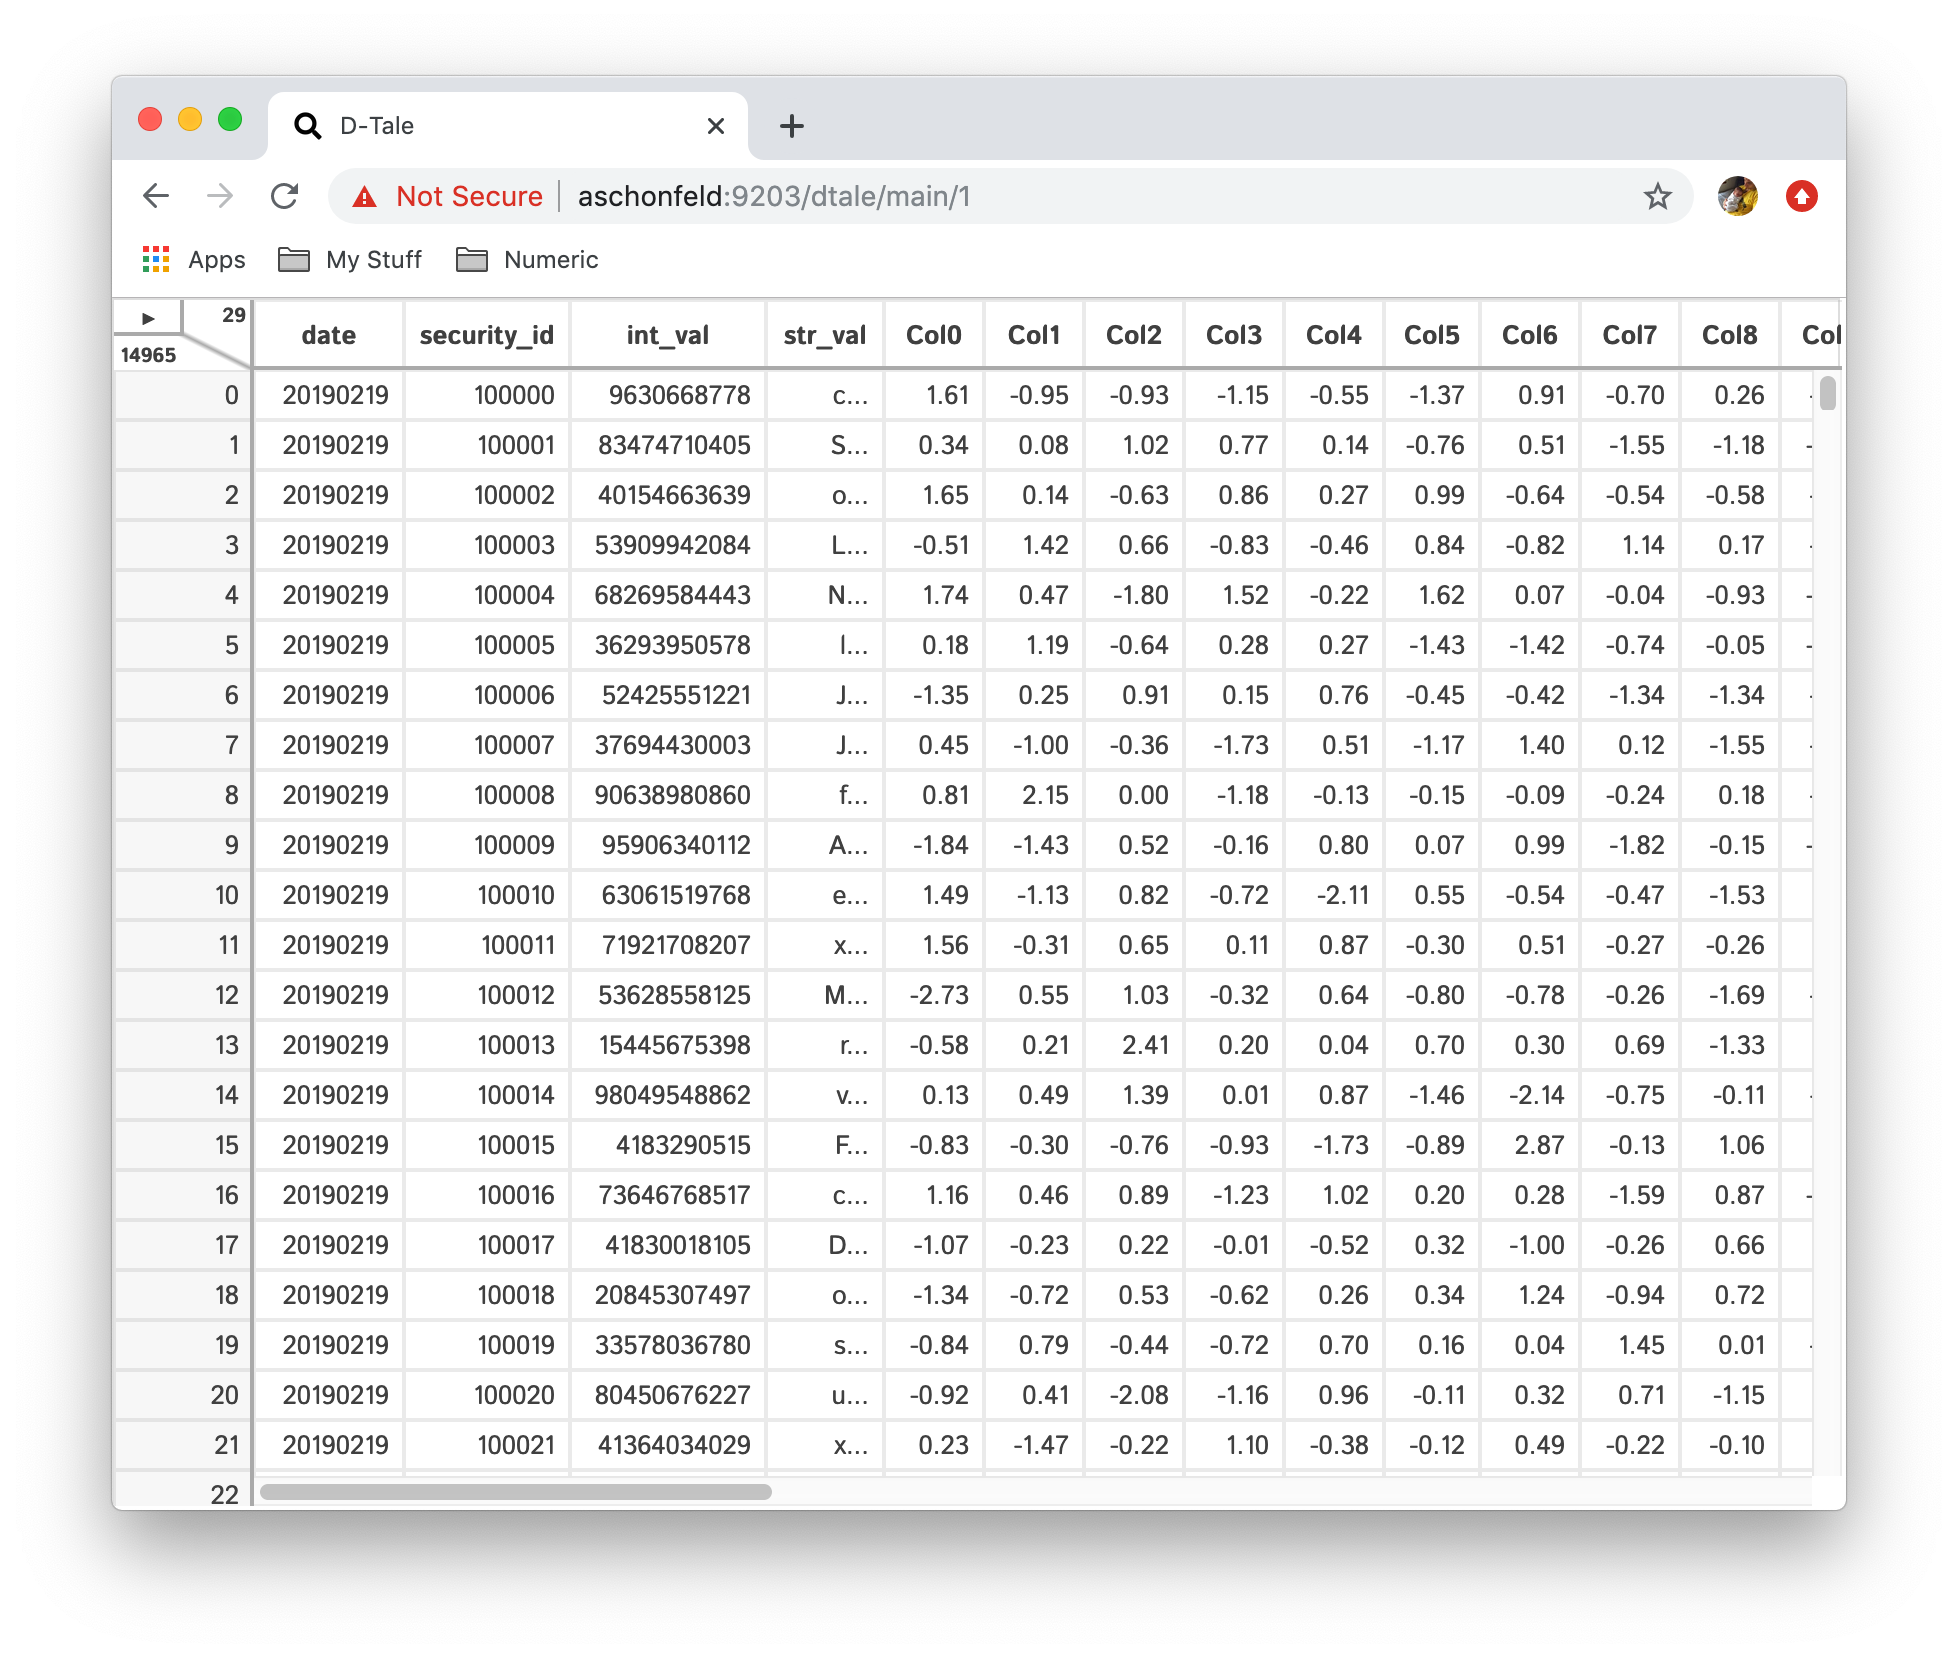 |
Here's a grid of all the formats available with -123456.789 as input:
| Format | Output |
|---|---|
| Precision (6) | -123456.789000 |
| Thousands Sep | -123,456.789 |
| Abbreviate | -123k |
| Exponent | -1e+5 |
| BPS | -1234567890BPS |
| Red Negatives | -123457 |
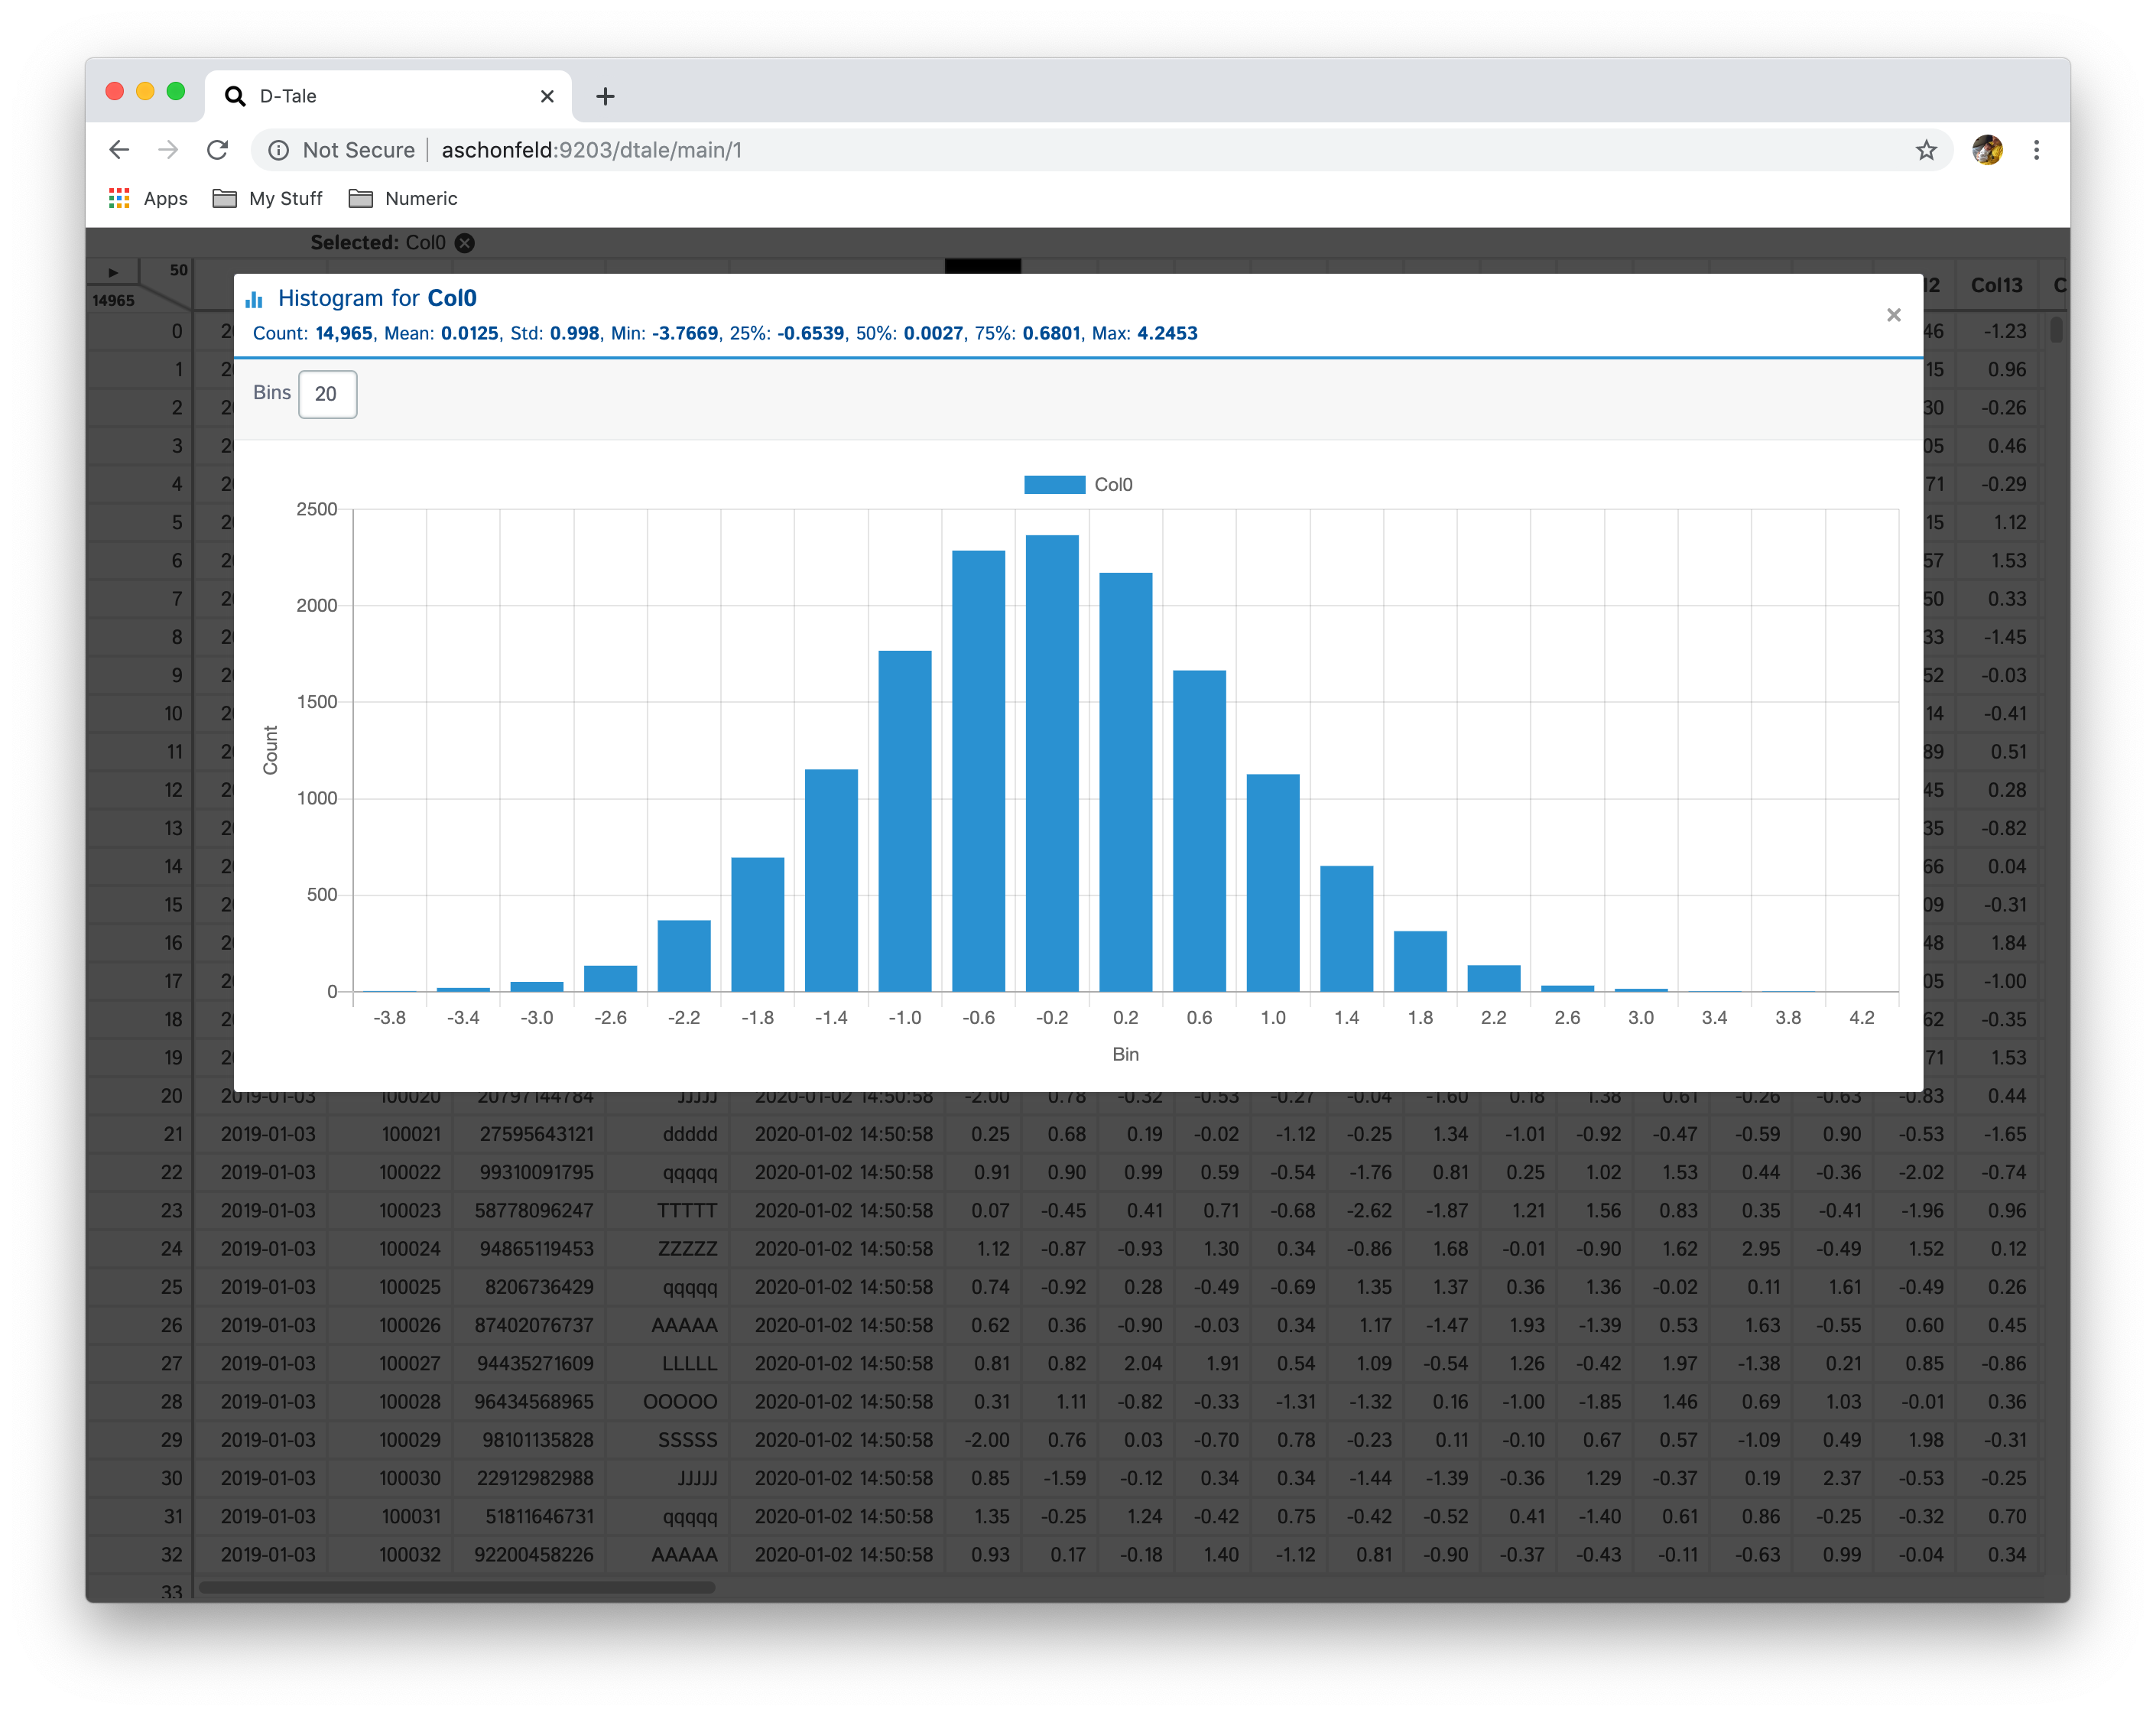
Display histograms in any number of bins (default: 20), simply type a new integer value in the bins input
Depending on the dimensions of your browser window the following buttons will not open modals, but rather separate browser windows: Correlations, Describe & Instances (see images from Jupyter Notebook, also Charts will always open in a separate browser window)
Clone the code (git clone ssh://git@github.com:manahl/dtale.git), then start the backend server:
$ git clone ssh://git@github.com:manahl/dtale.git
# install the dependencies
$ python setup.py develop
# start the server
$ python dtale --csv-path /home/jdoe/my_csv.csv --csv-parse_dates date
You can also run dtale from PyDev directly.
You will also want to import javascript dependencies and build the source:
$ npm install
# 1) a persistent server that serves the latest JS:
$ npm run watch
# 2) or one-off build:
$ npm run buildThe usual npm test command works:
$ npm test
You can run individual test files:
$ TEST=static/__tests__/dtale/DataViewer-base-test.jsx npm run test-file
You can lint all the JS and CSS to confirm there's nothing obviously wrong with it:
$ npm run lint -sYou can also lint individual JS files:
$ npm run lint-js-file -s -- static/dtale/DataViewer.jsxYou can auto-format code as follows:
$ npm run formatYou can build python 27-3 & run D-Tale as follows:
$ yarn run build
$ docker-compose build dtale_2_7
$ docker run -it --network host dtale_2_7:latest
$ python
>>> import pandas as pd
>>> df = pd.DataFrame([dict(a=1,b=2,c=3)])
>>> import dtale
>>> dtale.show(df)
Then view your D-Tale instance in your browser using the link that gets printed
You can build python 36-1 & run D-Tale as follows:
$ yarn run build
$ docker-compose build dtale_3_6
$ docker run -it --network host dtale_3_6:latest
$ python
>>> import pandas as pd
>>> df = pd.DataFrame([dict(a=1,b=2,c=3)])
>>> import dtale
>>> dtale.show(df)
Then view your D-Tale instance in your browser using the link that gets printed
Here's a little background on how the dtale.show() function works:
dtale.show(df) our state is:| Session | Port | Active Data IDs | URL(s) |
|---|---|---|---|
| 1 | 40000 | 1 | http://localhost:40000/dtale/main/1 |
dtale.show(df) our state is:| Session | Port | Active Data IDs | URL(s) |
|---|---|---|---|
| 1 | 40000 | 1,2 | http://localhost:40000/dtale/main/[1,2] |
dtale.show(df) our state is:| Session | Port | Active Data IDs | URL(s) |
|---|---|---|---|
| 1 | 40000 | 1,2 | http://localhost:40000/dtale/main/[1,2] |
| 2 | 40001 | 1 | http://localhost:40001/dtale/main/1 |
dtale.show(df, port=40001, force=True) our state is:| Session | Port | Active Data IDs | URL(s) |
|---|---|---|---|
| 1 | 40001 | 1,2,3 | http://localhost:40001/dtale/main/[1,2,3] |
dtale.show(df) our state is:| Session | Port | Active Data IDs | URL(s) |
|---|---|---|---|
| 1 | 40001 | 1,2,3 | http://localhost:40001/dtale/main/[1,2,3] |
| 3 | 40000 | 1 | http://localhost:40000/dtale/main/1 |
dtale.show(df) our state is:| Session | Port | Active Data IDs | URL(s) |
|---|---|---|---|
| 1 | 40001 | 1,2,3 | http://localhost:40001/dtale/main/[1,2,3] |
| 3 | 40000 | 1 | http://localhost:40000/dtale/main/1 |
| 2 | 40002 | 1 | http://localhost:40002/dtale/main/1 |
dtale.show(df, port=8080) our state is:| Session | Port | Active Data IDs | URL(s) |
|---|---|---|---|
| 1 | 40001 | 1,2,3 | http://localhost:40001/dtale/main/[1,2,3] |
| 3 | 40000 | 1 | http://localhost:40000/dtale/main/1 |
| 2 | 40002 | 1 | http://localhost:40002/dtale/main/1 |
| 4 | 8080 | 1 | http://localhost:8080/dtale/main/1 |
dtale.get_instance(1).kill() our state is:| Session | Port | Active Data IDs | URL(s) |
|---|---|---|---|
| 1 | 40001 | 2,3 | http://localhost:40001/dtale/main/[2,3] |
| 3 | 40000 | 1 | http://localhost:40000/dtale/main/1 |
| 2 | 40002 | 1 | http://localhost:40002/dtale/main/1 |
| 4 | 8080 | 1 | http://localhost:8080/dtale/main/1 |
dtale.show(df) our state is:| Session | Port | Active Data ID(s) | URL(s) |
|---|---|---|---|
| 1 | 40001 | 2,3 | http://localhost:40001/dtale/main/[2,3] |
| 3 | 40000 | 1 | http://localhost:40000/dtale/main/1 |
| 2 | 40002 | 1 | http://localhost:40002/dtale/main/1 |
| 4 | 8080 | 1 | http://localhost:8080/dtale/main/1 |
| 5 | 30000 | 1 | http://localhost:30000/dtale/main/1 |
Have a look at the detailed documentation.
D-Tale works with:
D-Tale has been under active development at Man Numeric since 2019.
Original concept and implementation: Andrew Schonfeld
Contributors:
Contributions welcome!
D-Tale is licensed under the GNU LGPL v2.1. A copy of which is included in LICENSE