facebookresearch / hiplot
- понедельник, 3 февраля 2020 г. в 00:18:40
TypeScript
HiPlot makes understanding high dimensional data easy

![]()
HiPlot is a lightweight interactive visualization tool to help AI researchers discover correlations and patterns in high-dimensional data using parallel plots and other graphical ways to represent information.
There are 2 modes to HiPlot:
pip install hiplotIf you have a jupyter notebook, you can get started with something as simple as:
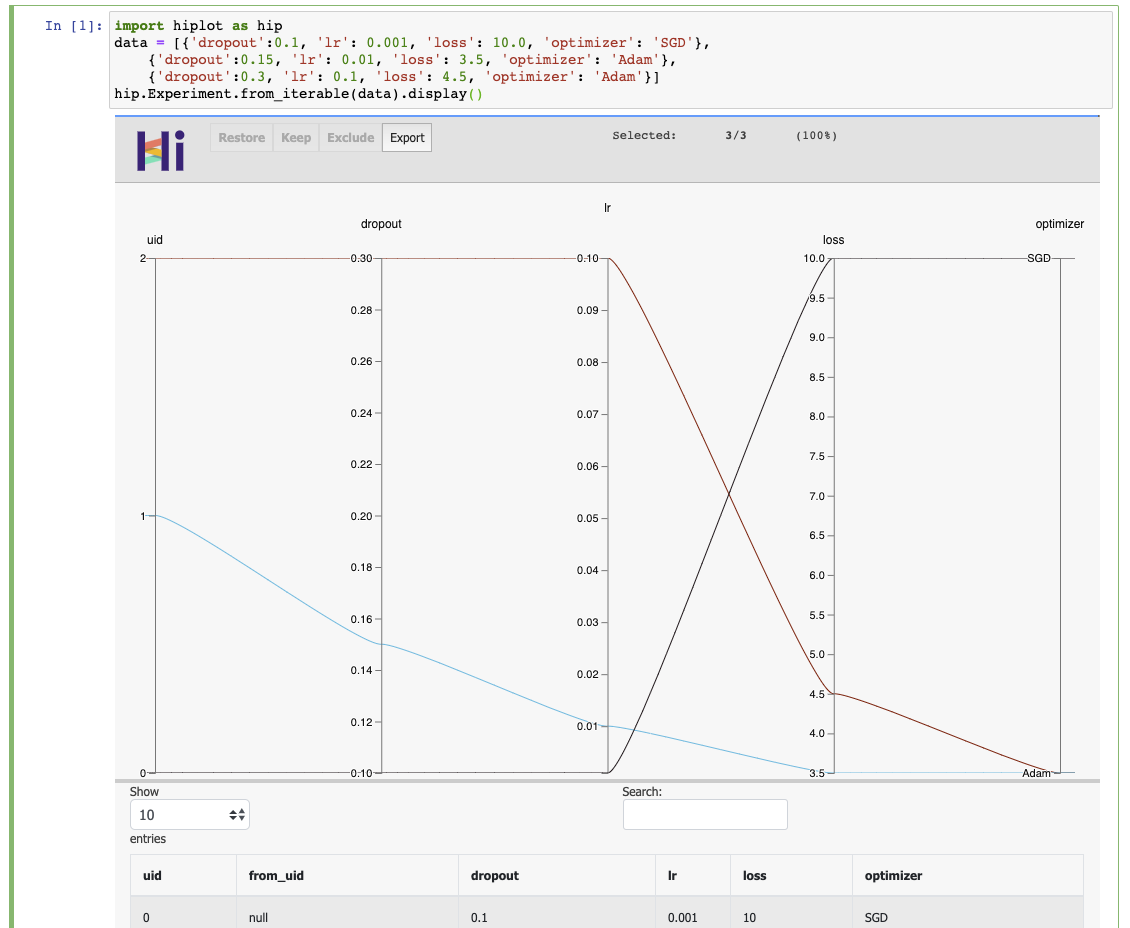
import hiplot as hip
data = [{'dropout':0.1, 'lr': 0.001, 'loss': 10.0, 'optimizer': 'SGD'},
        {'dropout':0.15, 'lr': 0.01, 'loss': 3.5, 'optimizer': 'Adam'},
        {'dropout':0.3, 'lr': 0.1, 'loss': 4.5, 'optimizer': 'Adam'}]
hip.Experiment.from_iterable(data).display()