https://habr.com/en/post/440090/- Finance in IT
- Mathematics
- Open source
- Statistics in IT
Anyone, who has ever been interested in stocks or cryptocurrencies has seen these additional lines on charts. You may have heard the opinions that they don’t work. But they greatly improve my trading ability, while displaying alot of important data. But how are they actually works? And to whom it can be useful?
You should definitely read this if:
- You use them in day trading
- You are planning to write a trading bot
- If you want to implement a trading strategy or indicators by yourself

Most often
technical indicators are a window function, recursive function or weighted function of prices/volumes that is pulled from the stock exchange in the UOHLCV format (unix time, open, high, low, close, volume). It is not uncommon for indicators to use different filtering, minimums and maximums or other indicators as a basis for subsequent calculations.
Simple moving average (SMA)
When coding indicators, it is very convenient to use functional approach. For example, the moving average it is just the average of each value of the rolling window.
function sma($close, window) {
  return rolling(x => mean(x), window, $close);
}
where
mean is operation that calculates the average of array and
rolling is the combination of the window function that for each existing element in the array produces an array of the last n elements and the
operation that folds this window into a number.
function rolling(operation, window, array) {
  let result = [];
  for (let i = 0; i < array.length; i++) {
    if (i + 1 < window) {
      result.push(NaN);
    } else {
      result.push(operation(array.slice(i + 1 - window, i + 1)));
    }
  }
  return result;
}
The
SMA is a lagging indicator and helps determine the trend. It’s drawn as overlay on chart and first values usually discarded. Two moving averages can be used together to generate crossover signals.
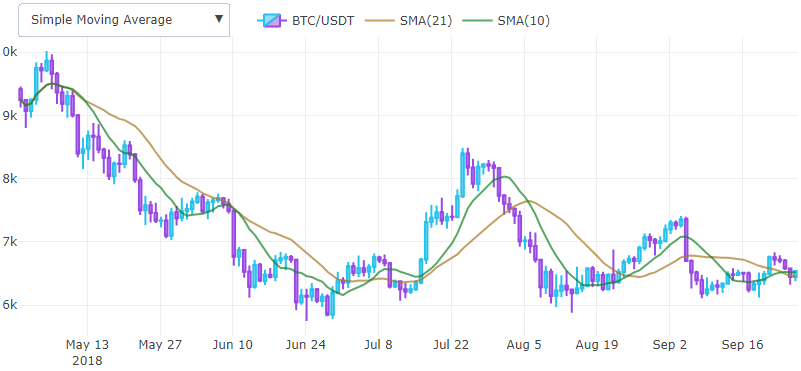
A bullish crossover occurs when one relatively short moving average breakouts long moving average. Exponentially weighted moving average is more often used in practice, because a weighted window function reduce the delay effect.
Standard deviation (STDEV)
If we replace the
mean function in SMA with the standard deviation we will get a sliding standard deviation
function stdev($close, window) {
  return rolling(x => sd(x), window, $close);
}
Where
sd is considered to be square root of variance and commonly without Bessel correction. We will assume that everyone understands how to implement
sd
Square root of the variance is used because the variance itself measured in suqare dollars in term of dimension theory and not because somebody registered trademark or whatever.
Bollinger Bands (BBAND)
Thus we have already implemented two basic indicators which we can combine and get new ones. For example, if we consider pointwise addition of the moving average and standard deviation multipled by 2, we will get the upper part of the Bollinger band and the lower part we will get if we subtract.
function bb($close, window, mult) {
  let middle = sma($close, window);
  let upper = pointwise((a, b) => a + b * mult, middle, stdev($close, window));
  let lower = pointwise((a, b) => a - b * mult, middle, stdev($close, window));
  return { lower : lower, upper : upper};
}
where function
pointwise is another useful functional
export function pointwise(operation, ...arrays) {
  let result = [];
  for (let i = 0, len = arrays[0].length; i < len; i++) {
    let iarr = (i) => arrays.map(x => x[i]);
    result[i] = operation(...iarr(i));
  }
  return result;
}
and it’s just perform
operation with several arrays
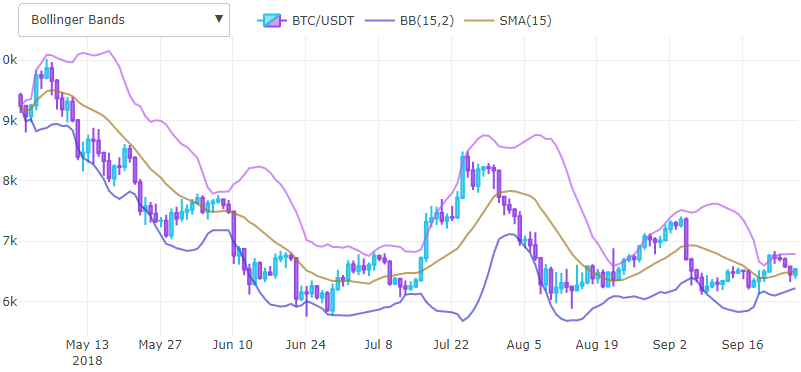
Bollinger bands help to determine the calm before the big price movement, and are used as a tool for displaing volatility right on the chart, the standard deviation substracted/added from moving average in order to be displayed as overlay on one chart with the price.
Exponential moving average (EMA)
How can we reduce the lag of the simple moving average? Since it calculates mean of the last n closing prices we can understand that we can perform summation with some weight and reduce the contribution of old prices.
For example if we choose
and a constant
that is less than one, then we get an infinitely decreasing weight, if we will add the prices starting with the newest.

Also it is possible to approximate calculations and get recursive equation if we expand the window to the full length and assume that the contribution of the tails is small.
Finnally we need some value α = 1−q as a smoothing constant. It is possible to
proof that when we choose
center of mass of EMA and SMA weight charts above become equal. In code this looks much more simpler.
function ema($close, window, weight = null) {
  weight = weight ? weight : 2 / (window + 1);
  let ema = [ mean($close.slice(0, window)) ];
  for (let i = 1; i < $close.length; i++) {
    ema.push($close[i] * weight + ema[i - 1] * (1 - weight));
  };
  return ema;
}
In general this is the same moving average but more sensitive.

he effectiveness of the usage depends on your experience and the used settings. For example on
this site the parameters are chosen pretty well.
Moving average convergence divergence (MACD)
Gerald Appel in 1979 came up with one of the simplest and most effective indicators available. It turns two trend EMA indicators into a momentum oscillator and offers the best of both worlds: trend following and momentum. Roughly speaking MACD histogram it is a derivative of price. It is drawn in a new coordintate system rather than an overlay and it represents with two lines and one histogram.
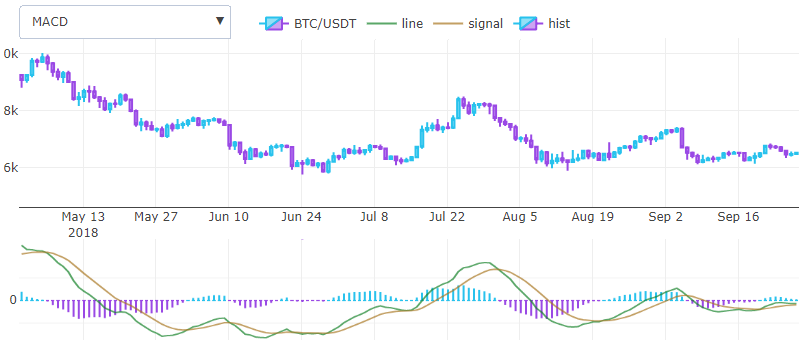
To calculate MACD line we need to substract long EMA from short, that’s all. Another EMA of this line with tiny window will produce the signal line. The histogram is obtained by difference between the two previous results.
function macd($close, wshort, wlong, wsig) {
  let line = pointwise((a, b) => a - b, ema($close, wshort), ema($close, wlong));
  let signal = ema(line, wsig);
  let hist = pointwise((a, b) => a - b, line, signal);
  return { line : line, signal : signal, hist : hist };
}
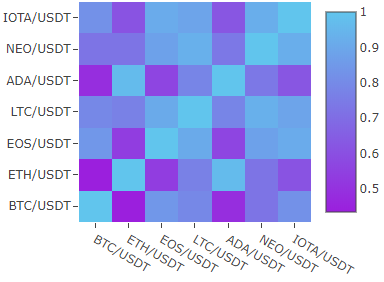
Correlation matrix
If you intrested in long term investition and portfolio analysis you will find usefull the correlation matrix.
function cor(f, g) {
  let Ef = mean(f), Eg = mean(g);
  let Ef2 = mean(pointwise((a) => a * a, f));
  let Eg2 = mean(pointwise((a) => a * a, g));
  let Efg = mean(pointwise((a, b) => a * b, f, g));
  return (Efg - Ef * Eg) / Math.sqrt((Ef2 - Ef * Ef) * (Eg2 - Eg * Eg));
}
Here correlation matrix of different cryptoassets in 2 month.
Indicator unit testing
If we have accurate tables of indicator values we can precisely test our calculation. There are various ways of determining the measure of error between the two functions but in this case the normalized mean square error is better fit because it is dimensionless quantity in contrast to RMSE and it is relative.
For example, bitcoin can cost $20,000 and a difference in $10 is small, while when entire altcoin can cost $1 and difference in $10 is huge.
function nrmse(f, g) {
  let sqrDiff = pointwise((a, b) => (a - b) * (a - b), f, g);
  return Math.sqrt(mean(sqrDiff)) / (Math.max(...f) - Math.min(...f));
}
We can also use MAPE but it’s not comutative and have a problem near zero.
Conclusion
So that’s it. In a few lines of code we can express the basic technical indicators, if you like this explonation check my library on github. There you can find much more. If you want to use some machine learning algorithms for your bot check Zig-Zag indicator as entry points.
References
1.
StockCharts — a list of algorithms with test data in the tables.
2.
Cryptowatch — well-tuned parameters of indicators.
3.
Github — my source code.
P.S. If you find any errors in the text please tell me in direct.